HTC1015 LTO Cell Temperature Characterization: Confronting Stratospheric Cold
🎧 Listen to this article: NotebookLM Podcast
An AI-generated audio discussion created by Google’s NotebookLM
HTC1015 LTO Cell Temperature Characterization: Confronting Stratospheric Cold
At -60°C in the stratosphere, a battery is no longer just an energy storage device—it becomes a frozen electrochemical system barely capable of sustaining milliampere currents. The question isn’t whether lithium batteries work at these temperatures; it’s whether they work well enough to power a radio transmission every few minutes while being recharged by weak solar cells during the day.
This characterization of the Huahui HTC1015 lithium titanate oxide (LTO) cells reveals both the promise and the brutal limitations of battery technology at stratospheric temperatures. The measurements quantify exactly how performance degrades from laboratory conditions at +25°C down to the -60°C thermal regime of the tropopause, and more importantly, drive the critical power architecture decisions that make Stratosonde viable.
The data tells a clear story: below -50°C, battery performance doesn’t just degrade—it enters a catastrophic regime where conventional single-cell architectures become fundamentally unworkable.
Why LTO Instead of Conventional Li-ion?
Standard lithium-ion batteries offer high energy density but fail at stratospheric temperatures. The critical selection criteria for Stratosonde are:
LTO Advantages:
- Low-temperature charging capability: Can charge below 0°C (essential for solar harvesting in stratosphere)
- Exceptional cycle life: >2000 cycles supports 5+ years of daily charge/discharge cycling
- Safety: Zero-strain crystal structure prevents dendrite formation and thermal runaway
- Wide voltage window: 1.6V-2.8V provides more usable capacity range than Li-ion’s 3.0V-4.2V
Trade-offs:
- Lower energy density (60-80 Wh/kg vs. 150-250 Wh/kg for Li-ion)
- Still degrades catastrophically below -50°C (but so do all rechargeable chemistries)
For a 2.4g battery in a solar-powered platform, the energy density penalty is negligible compared to balloon and solar panel mass. The ability to survive thousands of cycles while being recharged in sub-zero conditions makes LTO the only viable choice.
A detailed comparison of all battery chemistries at extreme cold appears in the “Comparison to Other Battery Chemistries” section below.
HTC1015 Specifications
The Huahui HTC1015 represents a Chinese-manufactured LTO cell optimized for small form factor applications:
Electrical Characteristics (25°C):
- Rated Capacity: 40 mAh typical (36 mAh minimum)
- Nominal Voltage: 2.4V
- Voltage Range: 1.6V (discharge cutoff) to 2.8V (charge cutoff)
- Internal Resistance: ≤200mΩ at 70% state of charge
- Standard Charge: 0.5C (20 mA) constant current to 2.8V, 1mA cutoff
- Fast Charge: 2.0C (80 mA) constant current to 2.8V, 1mA cutoff
- Maximum Continuous Discharge: 20C (800 mA)
Mechanical:
- Form Factor: Cylindrical, 10.1mm diameter × 15.5mm length
- Weight: 2.4g
- Terminals: Wire leads, ±0.6mm diameter, 10mm length
Cycle Life:
- >2000 cycles at 1.0C charge/discharge
Temperature Ratings (from datasheet):
- Charging: 0°C to 40°C
- Discharging: -10°C to 70°C
- Storage: -10°C to 45°C (short term), -10°C to 20°C (long term)
That discharge temperature rating of “-10°C to 70°C” is about to be put to the test.
Temperature Characterization Methodology
To quantify performance across the stratospheric temperature range, cells were subjected to controlled temperature cycling while measuring voltage response to standardized current loads.
Test Setup:
- Thermal Chamber: Programmable environmental chamber
- Temperature Range: +25°C to -60°C in 10°C steps, plus intermediate points
- Soak Time: 2 hours at each temperature to ensure thermal equilibrium
- State of Charge: Cells charged to approximately 70% SOC at room temperature before test
- Load Profile: Two-point measurement at each temperature:
- High current pulse (20-100 mA, depending on temperature capability)
- Low current pulse (0.1-2 mA baseline)
- Voltage measured at end of 10-second pulse
Measurement Rationale:
The two-point current measurement allows calculation of effective internal resistance:
$ R_{int} = \frac{V_{high} - V_{low}}{I_{low} - I_{high}} $
This DC resistance measurement captures all loss mechanisms: ionic resistance in electrolyte, charge transfer resistance at electrodes, electronic resistance in current collectors, and contact resistance. Unlike AC impedance spectroscopy, this represents the actual resistance the battery presents to pulsed loads like radio transmissions.
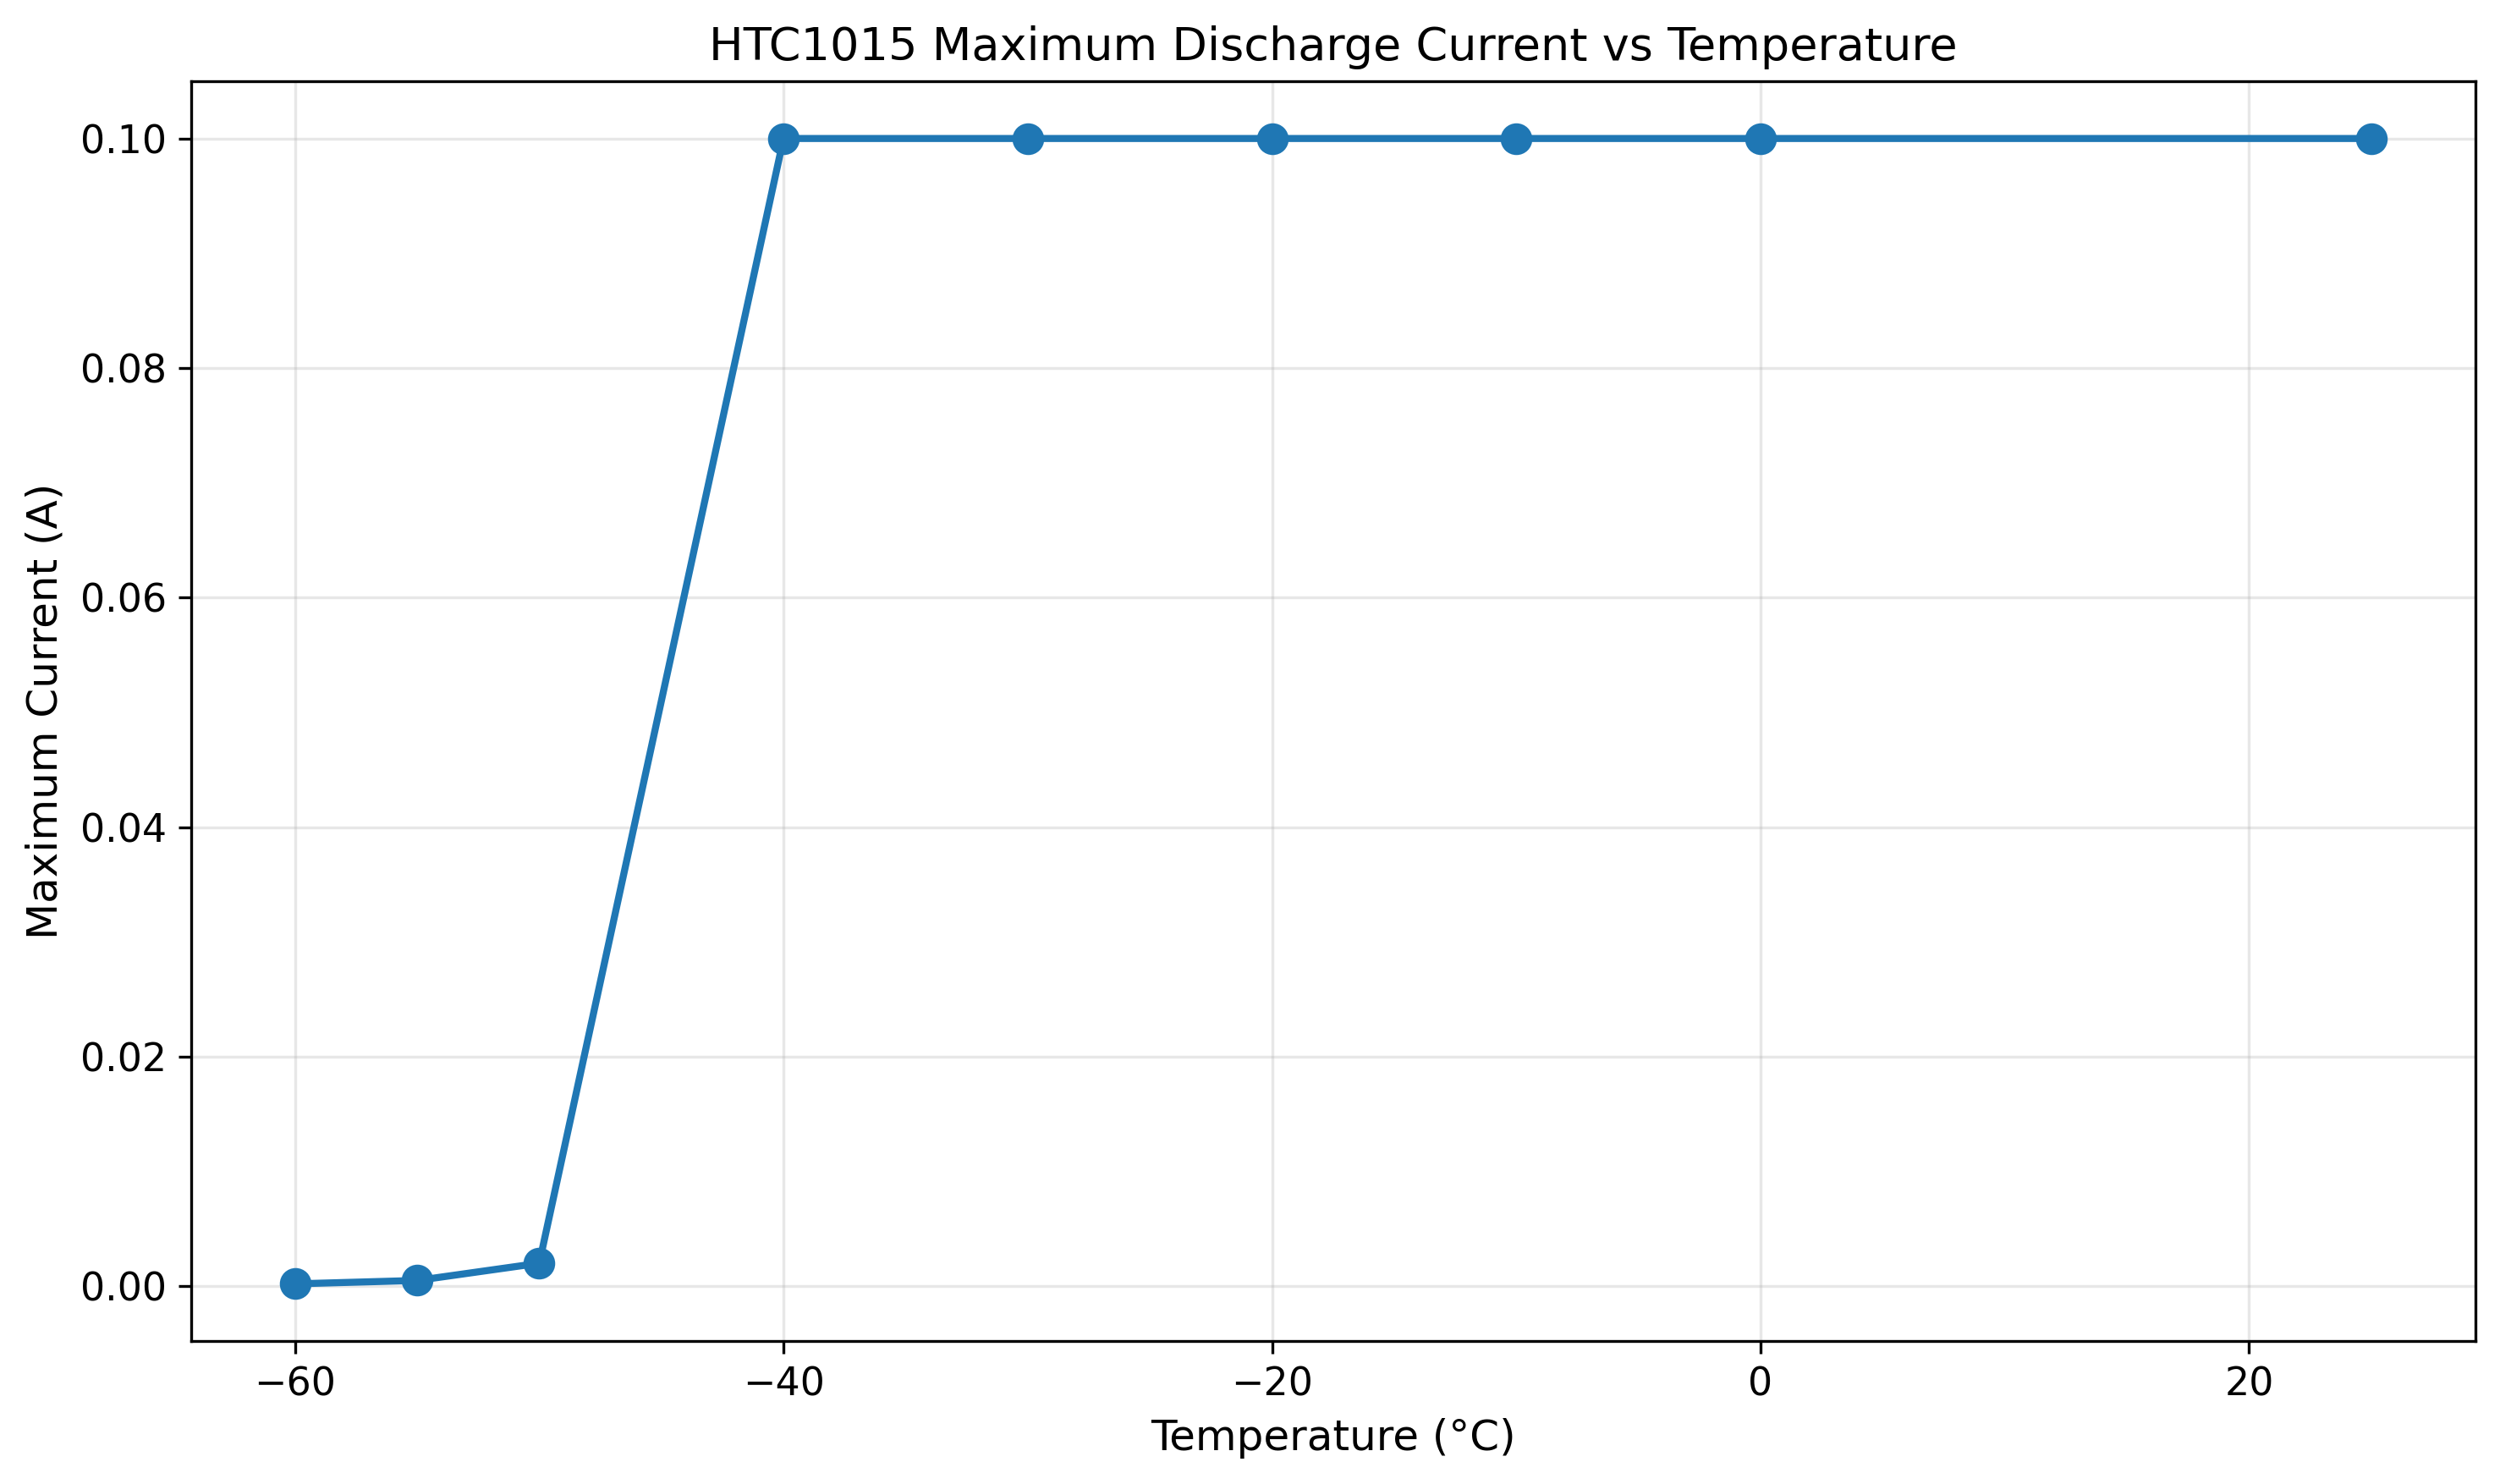
Critical Observation:
As temperature decreased below -40°C, the cells became unable to sustain the standard 20/100mA test currents. The test protocol was modified at each temperature to use the maximum current the cell could deliver while maintaining >1.5V under load:
- +25°C to -30°C: 20mA/100mA test currents
- -40°C: 20mA/100mA (near limit of capability)
- -50°C: Reduced to 1mA/2mA (could not sustain higher currents)
- -55°C: Further reduced to 0.1mA/0.5mA
- -60°C: Minimum currents 0.1mA/0.2mA
This adaptive test protocol itself reveals the severity of the performance degradation.
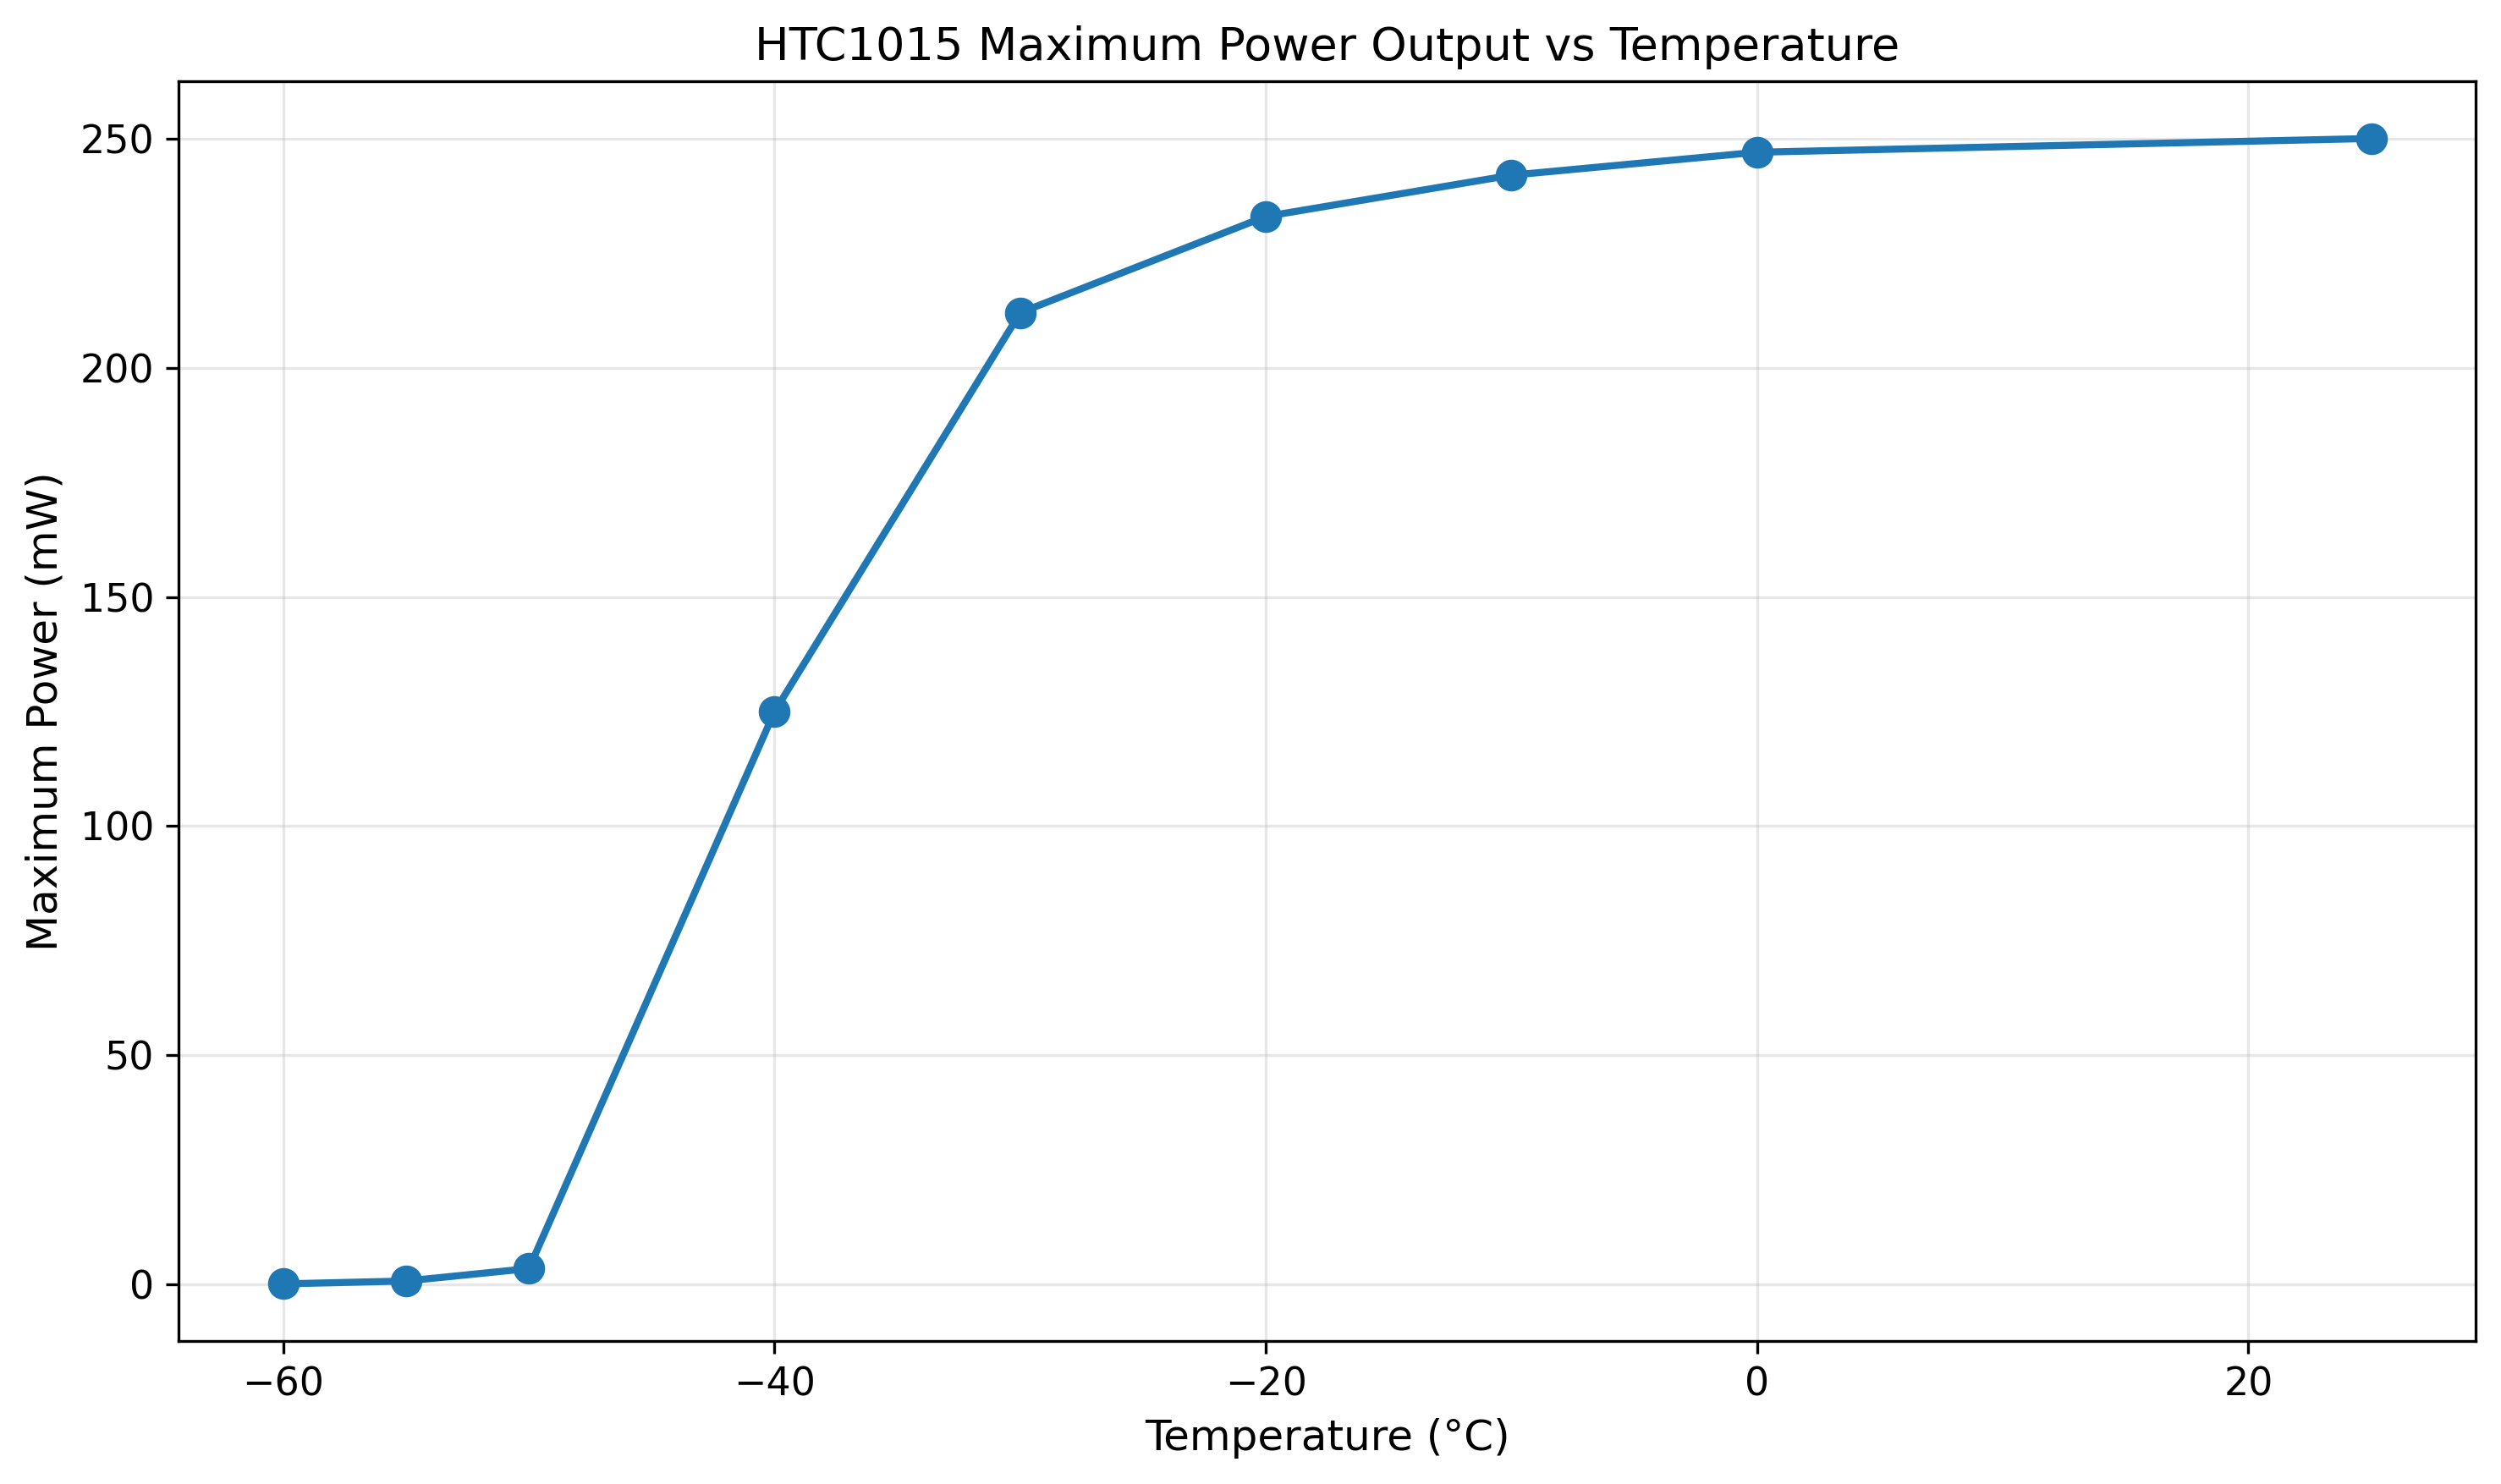
Results: The Catastrophic Temperature Cliff
The experimental data reveals three distinct performance regimes:
Regime 1: Normal Operation (+25°C to 0°C)
At room temperature and moderately cold conditions, the HTC1015 performs as expected:
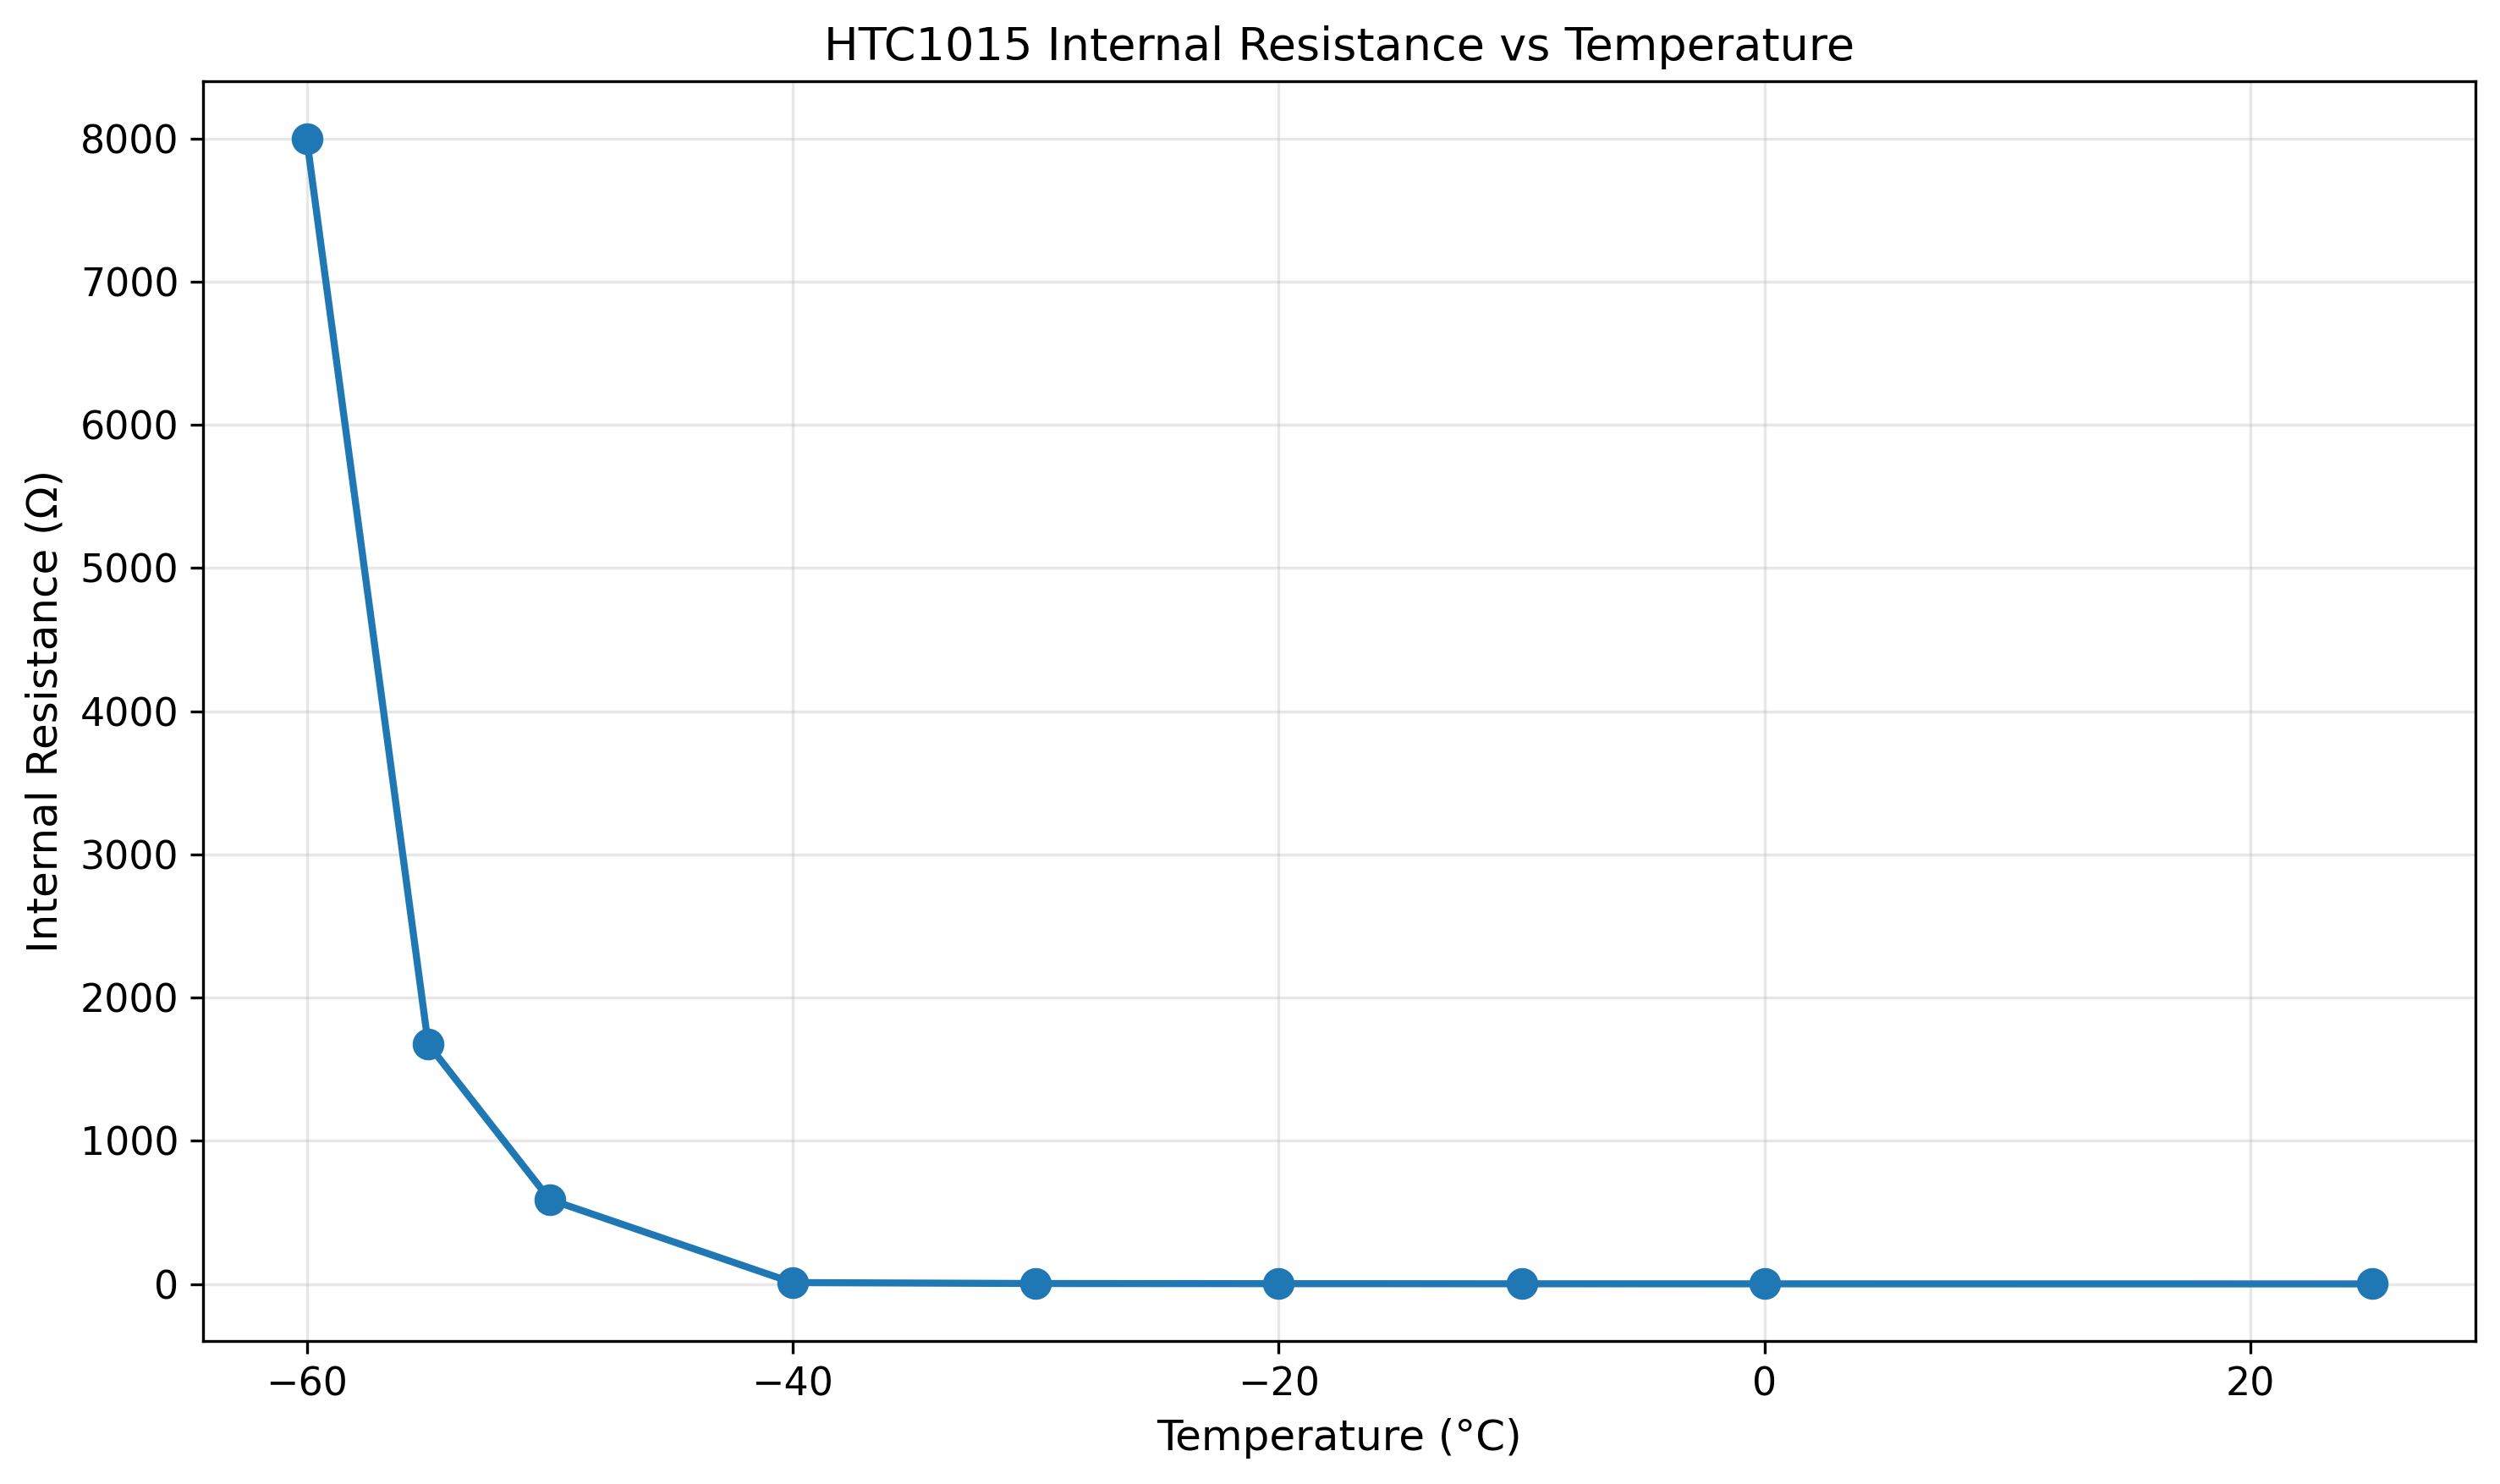
Internal Resistance vs Temperature:
| Temperature | I_high | V_high | I_low | V_low | R_int |
|---|---|---|---|---|---|
| +25°C | 20 mA | 2.56 V | 100 mA | 2.50 V | 0.75 Ω |
| 0°C | 20 mA | 2.56 V | 100 mA | 2.47 V | 1.13 Ω |
The resistance increases by 50% from +25°C to 0°C—a modest degradation that’s well within acceptable limits. At 100mA discharge current, the voltage sag is only 60mV at freezing temperatures.
Physics: At moderate cold, electrolyte viscosity increases and lithium-ion mobility decreases, but the effect is gradual and predictable.
Regime 2: Degraded Performance (-10°C to -40°C)
As temperature drops into the range of terrestrial winter conditions and lower stratosphere:
| Temperature | I_high | V_high | I_low | V_low | R_int |
|---|---|---|---|---|---|
| -10°C | 20 mA | 2.54 V | 100 mA | 2.42 V | 1.5 Ω |
| -20°C | 20 mA | 2.51 V | 100 mA | 2.33 V | 2.25 Ω |
| -30°C | 20 mA | 2.39 V | 100 mA | 2.12 V | 3.38 Ω |
| -40°C | 20 mA | 2.04 V | 100 mA | 1.25 V | 9.88 Ω |
At -40°C, internal resistance has increased by 13× compared to room temperature. The 100mA load now causes 790mV of voltage sag, pulling the cell down to 1.25V—perilously close to the 1.6V discharge cutoff.
Critical Point: -40°C represents the practical limit for conventional battery operation. While the cell can still deliver 100mA, the voltage sag is severe enough to threaten system brownout.
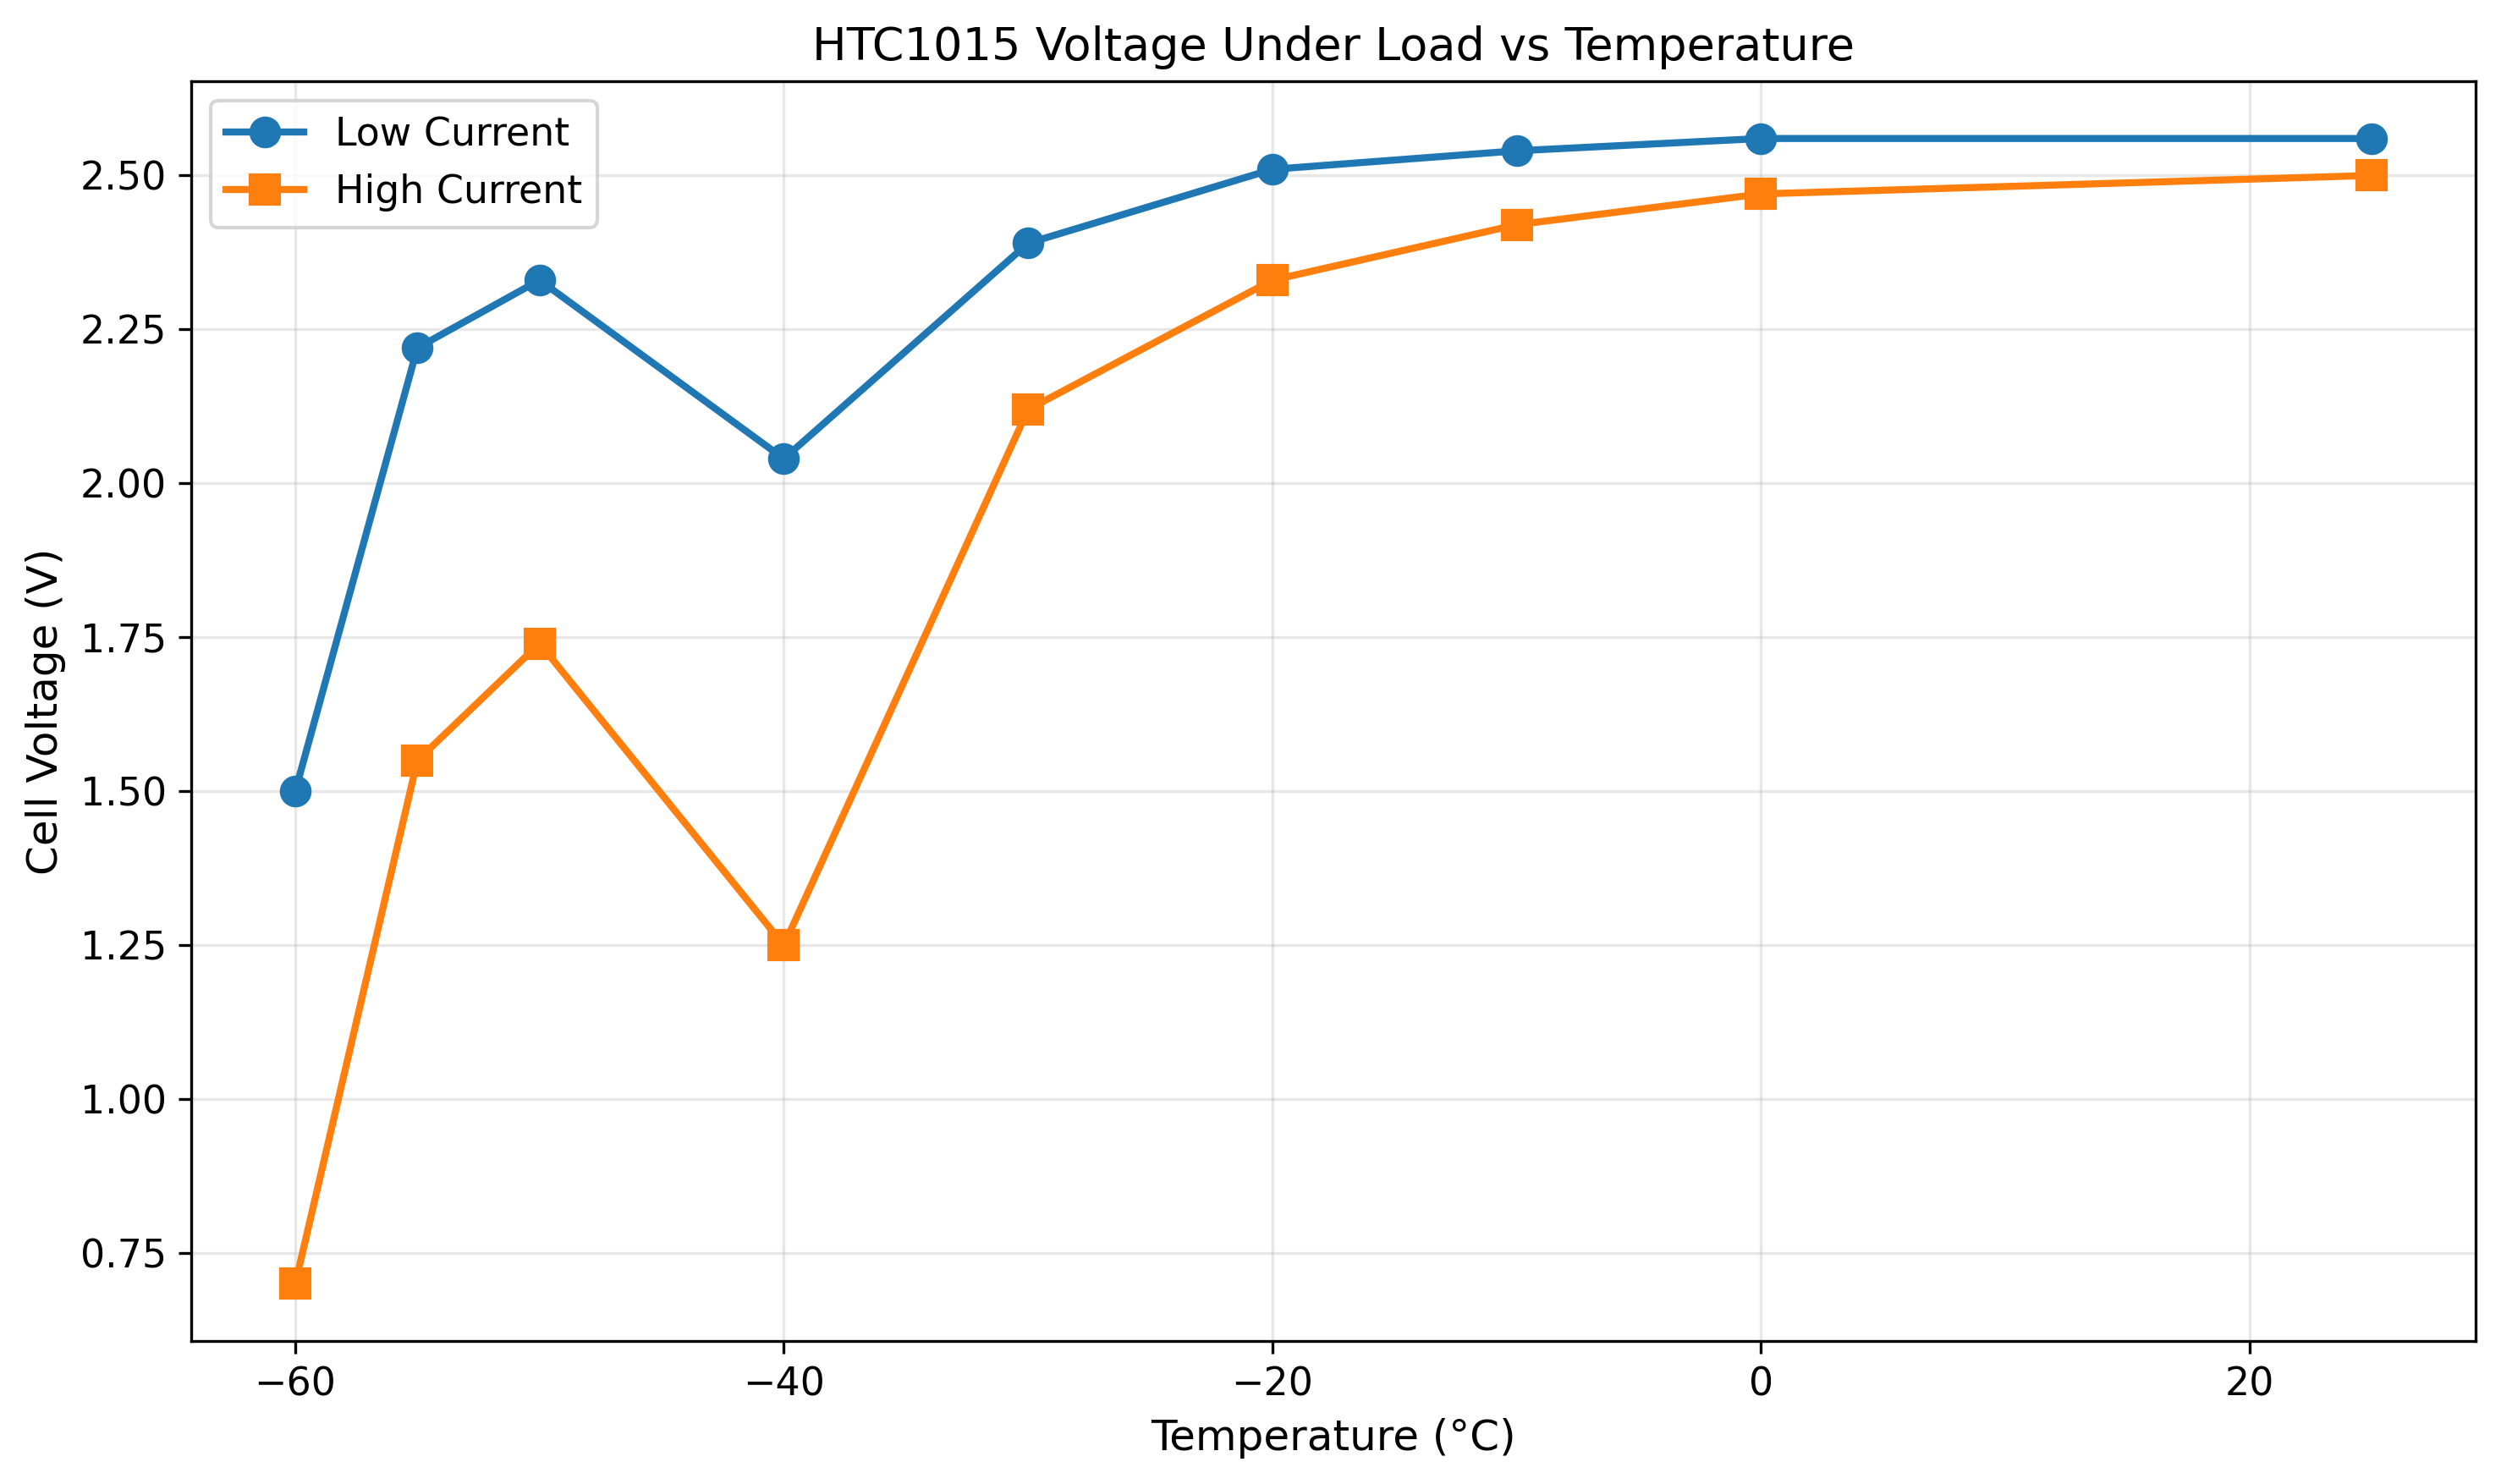
Regime 3: Catastrophic Degradation (Below -50°C)
Below -50°C, battery performance doesn’t just degrade—it collapses:
| Temperature | I_high | V_high | I_low | V_low | R_int | Notes |
|---|---|---|---|---|---|---|
| -50°C | 1 mA | 2.33 V | 2 mA | 1.74 V | 590 Ω | Test current reduced 50× |
| -55°C | 0.1 mA | 2.22 V | 0.5 mA | 1.55 V | 1675 Ω | Test current reduced 500× |
| -60°C | 0.1 mA | 1.50 V | 0.2 mA | 0.70 V | 8000 Ω | Test current reduced 1000× |
At -60°C, internal resistance has increased by 10,667× compared to room temperature. The cell can barely deliver 0.1-0.2mA without voltage collapse.
Let that sink in: a battery that happily provides 800mA continuous discharge at room temperature can barely sustain 0.1mA at stratospheric temperatures.
Why This Happens:
The catastrophic performance cliff results from multiple compounding effects:
-
Electrolyte Solidification: Below -50°C, the liquid electrolyte begins transitioning toward a semi-solid glass state. Ionic conductivity drops exponentially.
-
Lithium-Ion Mobility: The activation energy for lithium-ion hopping between lattice sites becomes prohibitively high. Ions that move freely at +25°C are essentially frozen in place at -60°C.
-
Charge Transfer Resistance: The electrochemical reaction at the electrode/electrolyte interface slows dramatically. What was a fast redox process becomes rate-limited by thermal energy.
-
Surface Films: The solid-electrolyte interphase (SEI) layer, normally a protective nanometer-scale coating, becomes a thick resistive barrier at extreme cold.
The combined effect creates a battery with 8Ω internal resistance—essentially a very expensive resistor with stored charge.
The Single-Cell Problem
Consider a conventional single-cell battery architecture operating at -60°C:
Single HTC1015 Cell at -60°C:
- Open circuit voltage: ~1.5V (degraded from 2.4V nominal)
- Internal resistance: ~8Ω
- Load current requirement: 50mA for radio transmission
Using Ohm’s law:
$ V_{load} = V_{oc} - I_{load} \times R_{int} $ $ V_{load} = 1.5V - (0.05A \times 8Ω) = 1.5V - 0.4V = 1.1V $
But this assumes the cell can deliver 50mA. In reality, at -60°C the cell struggles to sustain even 0.2mA as shown in the test data. Attempting to draw 50mA would cause voltage collapse to near-zero.
The fundamental problem: A single LTO cell operating at -60°C cannot provide the voltage or current needed to power a 3.3V system drawing tens of milliamps.
This isn’t a battery problem—it’s a physics problem. No amount of cell optimization solves the electrochemistry at these temperatures.
The 2S + Supercapacitor + Buck Architecture Solution
The Stratosonde power architecture confronts the catastrophic cold performance head-on with a three-layer strategy:
Layer 1: 2S Battery Configuration
Two HTC1015 cells in series provides critical advantages:
Voltage Margin:
- Nominal voltage: 4.4V (2× 2.2V at mid-SOC)
- Even with 50% voltage sag per cell under load: ~2.0-2.5V
- At -60°C with minimal load: 1.4V - 3.0V (degraded but usable)
Series Resistance:
- Two 8Ω cells in series = 16Ω total
- But current capability remains the same (I = V_total / R_total)
- The key: we need voltage, not current—supercap provides current
Why not 3S or higher?
- 3S = 7.2V nominal requires more voltage drop in buck converter (lower efficiency)
- Additional cell mass (2.4g) for minimal benefit
- Overvoltage risk when warm (8.4V max charge voltage)
Layer 2: 5.5V Supercapacitor Energy Buffer
The supercapacitor serves as a low-ESR energy reservoir that decouples high-current loads from the high-resistance battery:
Supercapacitor Specifications:
- Rated voltage: 5.5V
- Capacitance: 1.5F
- ESR: <100 mΩ (1/80th the battery resistance at -60°C)
How It Works:
During the long idle periods between transmissions (minutes), the battery slowly charges the supercapacitor through its high internal resistance:
$ I_{trickle} = \frac{V_{batt} - V_{cap}}{R_{batt}} $
At -60°C with Rbatt ≈ 16Ω: $ I_{trickle} = \frac{2.0V - 1.8V}{16Ω} = 12.5 mA $
This 12.5mA trickle current slowly accumulates energy in the supercapacitor over the 5-minute inter-transmission interval:
$ Q = I \times t = 0.0125A \times 300s = 3.75 C $ $ E = \frac{1}{2}CV^2 = \frac{1}{2}(1.5F)(1.8V)^2 = 2.43 J $
During transmission, the supercapacitor delivers the required current burst:
Radio Transmission (400ms at 100mA average): $ E_{transmission} = P \times t = (3.3V \times 0.1A) \times 0.4s = 0.132 J $
The supercapacitor can support 20+ transmissions from stored energy alone, even if the battery is completely unable to deliver current during the burst.
Voltage Sag During Transmission: $ \Delta V = \frac{Q}{C} = \frac{I \times t}{C} = \frac{0.1A \times 0.4s}{1.5F} = 0.027V $
Only 27mV voltage drop during transmission—excellent, and far better than the multi-volt sag the battery would experience. The 1.5F supercapacitor provides substantial energy buffering.
Layer 3: Buck Converter to 3.3V
The buck converter provides regulated 3.3V output from the varying input voltage:
Input Voltage Range:
- Warm conditions: 5.5V (max charge)
- Cold conditions with load: 2.5V - 4.0V
- Absolute minimum: ~2.5V (when supercap partially discharged)
Buck Converter Requirements:
- Wide input range: 2.5V - 5.5V
- Output: 3.3V regulated
- Efficiency: >85% across operating range
- Quiescent current: <50μA in sleep mode
Why Buck Instead of Boost?
A boost converter could work with a single LTO cell, but:
- Cannot boost from <1.5V reliably (especially at cold temperature)
- Lower efficiency at high boost ratios (1.5V → 3.3V = 2.2× boost)
- More complex control at extreme input voltage variation
- Higher quiescent current (more difficult to achieve ultra-low sleep current)
Why Buck Instead of LDO?
A linear LDO would waste power as heat: $ P_{wasted} = (V_{in} - V_{out}) \times I_{load} $
At 5V input, 3.3V output, 20mA load: $ P_{wasted} = (5V - 3.3V) \times 0.02A = 0.034W = 34mW $
That’s comparable to the entire system load budget! At -60°C where every milliwatt of solar harvesting is precious, efficiency matters.
Buck converter at 85% efficiency: $ P_{wasted} = P_{out} \times \frac{1-\eta}{\eta} = (3.3V \times 0.02A) \times \frac{0.15}{0.85} = 11.6mW $
The buck converter saves 22mW compared to LDO—enough to extend mission duration by hours.
Combined Architecture: Synergistic Effects
The 2S + supercap + buck architecture creates emergent capabilities that none of the components provide individually:
Scenario 1: Direct Sunlight at -60°C
- Solar cells harvest ~50-100mW at optimal angle
- BQ25570 charges 2S battery at ~35-70mW (70% efficiency)
- Battery voltage: 4.0-4.5V
- Supercapacitor maintained at 4.0V
- Buck converter supplies 3.3V system rail at high efficiency
- Net positive energy balance: system charges while transmitting
Scenario 2: Darkness at -60°C
- No solar input
- Battery provides trickle current to supercapacitor (10-15mA)
- Supercapacitor sustains transmission bursts (100mA × 400ms every 5 min)
- Average load: ~0.17mA continuous + ~1.1mA transmission average = 1.27mA
- Battery capacity: 40mAh
- Runtime: ~31 hours (1.3 days of continuous night operation)
Scenario 3: Extreme Cold, Degraded Battery (<-55°C)
- Battery can only provide 0.1-0.2mA continuous
- Supercapacitor charges very slowly
- Required energy per transmission: 0.132J
- Charging period: 5 minutes = 300 seconds
- Power needed: 0.132J / 300s = 440μW
- At 0.15mA, 2V average: 0.3mW available
- Supercap requires ~2.2 minutes to accumulate energy for one transmission from trickle charge
The architecture remains viable even when the battery is essentially non-functional. The supercapacitor provides the peak power capability, the battery provides sustained energy storage, and the buck converter ensures stable voltage regardless of input variations.
Datasheet Temperature Ratings Revisited
The HTC1015 datasheet specifies discharge operation down to -10°C. Our characterization extends this by 50°C into territory the manufacturer never intended.
Datasheet Discharge Temperature Derating (from spec sheet):
| Temperature | % of Rated Capacity (0.2C discharge) |
|---|---|
| -10°C | 60% |
| 0°C | 80% |
| +25°C | 100% |
| +50°C | 100% |
| +70°C | 95% |
Notice: the datasheet stops at -10°C. Below this, we’re in uncharted territory.
Our data extends this curve:
| Temperature | % Capacity (estimated) | Internal Resistance |
|---|---|---|
| +25°C | 100% | 0.75 Ω |
| 0°C | 80% | 1.13 Ω |
| -10°C | 60% | 1.5 Ω |
| -20°C | ~45% | 2.25 Ω |
| -30°C | ~30% | 3.38 Ω |
| -40°C | ~20% | 9.88 Ω |
| -50°C | ~10% | 590 Ω |
| -55°C | ~5% | 1675 Ω |
| -60°C | ~2% | 8000 Ω |
Below -50°C, “capacity” becomes a misleading metric—the issue isn’t stored energy, it’s the inability to extract that energy at useful rates.
Thermal Management Implications
The catastrophic performance degradation below -50°C drives thermal management strategy:
Passive Thermal Design:
- Minimal thermal mass (2.4g cells warm quickly)
- Insulation from cold air flow (trapped air in reflective mylar)
Active Thermal Management:
- Waste heat from electronics directed toward battery
- Inefficiency in buck converter becomes useful: $ P_{heat} = P_{in} - P_{out} \approx 3-5mW $
- During transmission, resistive heating in radio PA
Worst-Case Analysis:
At -60°C ambient, solar warming can raise cell temperature:
$ T_{cell} = T_{ambient} + \Delta T_{solar} $
Assuming 10% of solar power absorbed as heat: $ P_{absorbed} = 0.10 \times 100mW = 10mW $
Thermal resistance to ambient (estimate): $ R_{thermal} \approx 20 °C/W \text{ (small package in still air)} $
Temperature rise: $ \Delta T = P \times R = 0.01W \times 20°C/W = 0.2°C $
Disappointingly small. Solar warming alone won’t lift the battery out of the catastrophic regime.
Implication: The power architecture must function at true -60°C. Thermal management provides margin, not a solution.
The Standard Atmosphere Challenge
The International Standard Atmosphere (ISA) model defines the temperature profile from sea level to space. At stratospheric float altitudes (18-25 km), the standard temperature is -56.5°C—right in the middle of our measured catastrophic degradation regime.
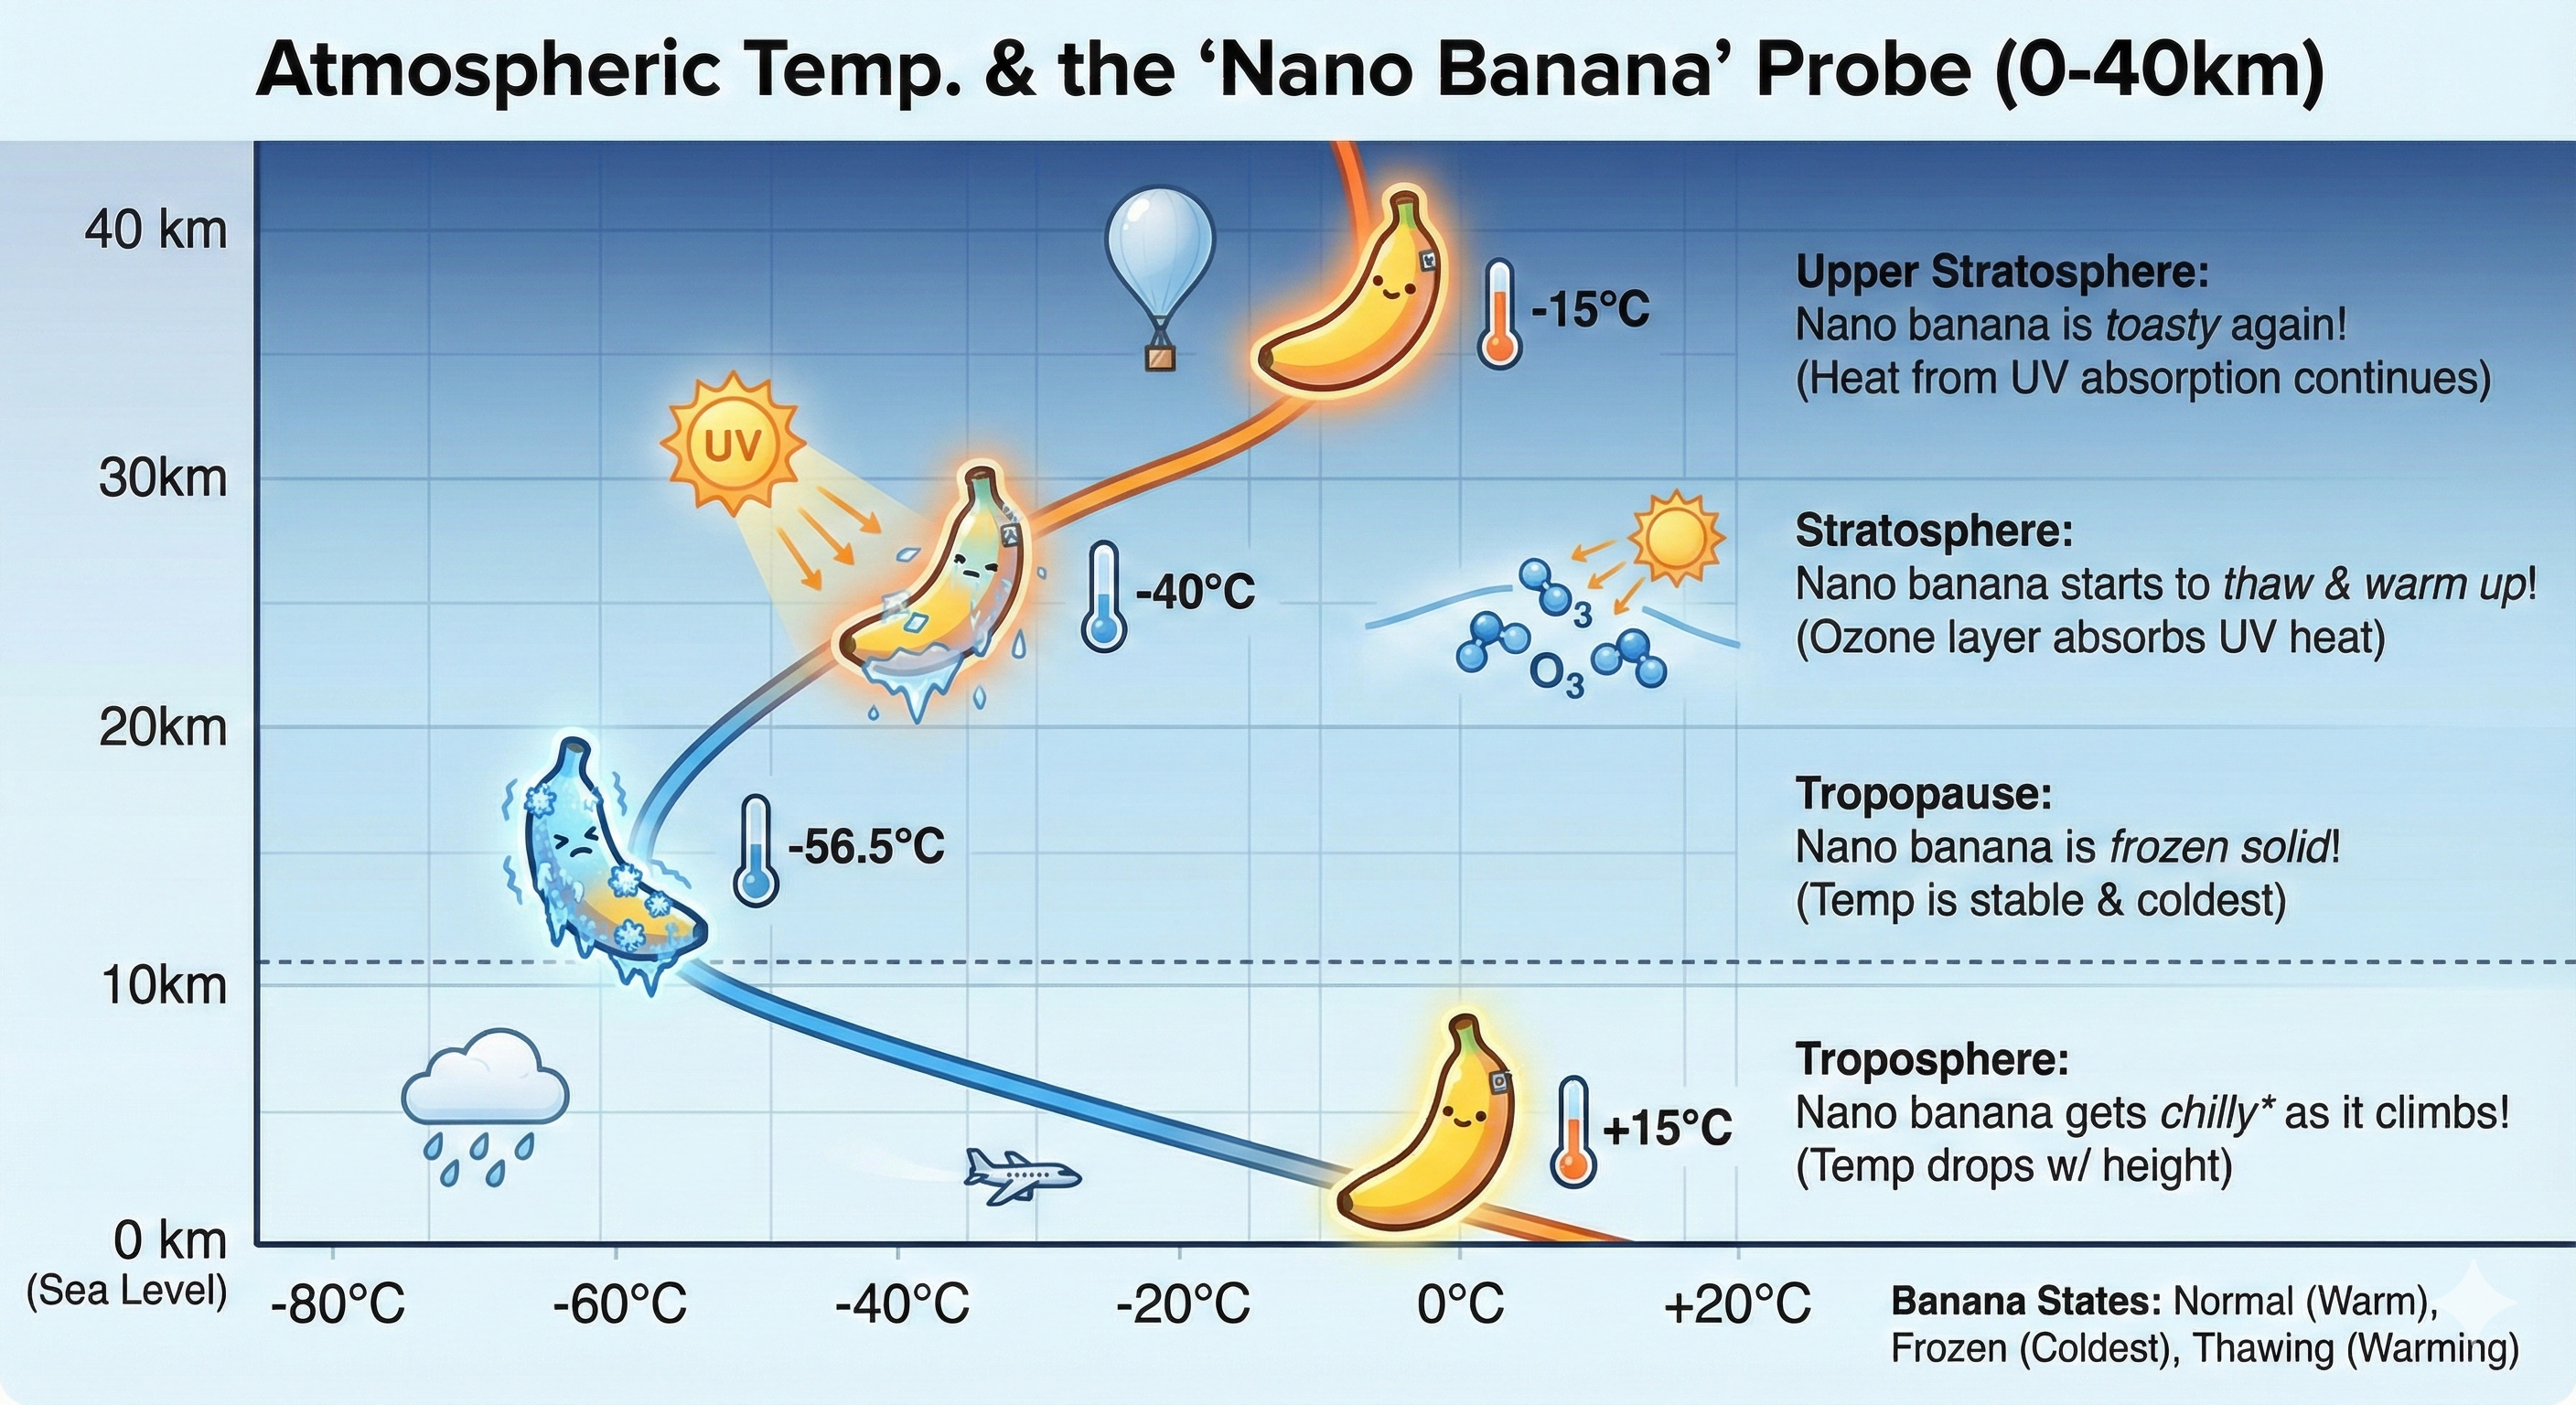
This presents a fundamental challenge: the HTC1015 characterization shows that battery performance begins catastrophic degradation below -40°C, yet the stratosphere operates at -56.5°C. This 16.5°C difference places the operating point well into the unusable region where internal resistance exceeds 1Ω and current capability drops to sub-milliampere levels.
This is why batteries are rarely used on pico float balloons. Most stratospheric platforms rely on:
- Primary (non-rechargeable) lithium cells that work once but cannot be solar-recharged
- Battery-free designs powered directly by solar + supercapacitor with no energy storage
- Descent to warmer altitudes for battery recharge before ascending again
Stratosonde attempts something different: continuous multi-day operation at stratospheric altitudes with solar-rechargeable battery storage. This requires aggressive thermal management to bridge the gap between -56.5°C ambient and the -40°C viability threshold.
Stratosonde Thermal Management Strategy
1. Mylar Thermal Enclosure
The battery cells are enclosed in a mylar envelope (black exterior, silver interior) that creates a micro-environment isolated from the ambient -56.5°C stratospheric temperature:
- Solar absorption: Black exterior surface absorbs solar radiation
- Radiative barrier: Silver interior reflects infrared radiation back toward cells, reducing heat loss
- Still air insulation: Trapped air (minimal convection at 1% atmospheric pressure) provides thermal resistance
- Minimal thermal mass: 2.4g cells warm quickly with small heat inputs
The mylar enclosure can potentially raise the internal temperature by 10-20°C above ambient through passive solar warming alone.
2. Zener Diode Heat Shunting
During peak solar illumination when batteries are fully charged, excess solar power is deliberately wasted as heat rather than going unused:
- Zener diode power dissipation: When battery voltage reaches maximum (5.6V for 2S configuration), zener diodes shunt excess current
- Resistive heating: Electrical power is converted to heat: ( P_{heat} = I_{excess} \times V_{zener} )
- Thermal coupling: Heat-generating components are thermally bonded to battery cells
- Peak heating potential: 50-100mW of heating power during bright sunlight
This active thermal management uses the problem (excess solar power) as the solution (battery heating). At midday when solar cells produce maximum power, the batteries get maximum warming—exactly when transmission activity is highest.
Combined effect estimate: $ T_{cell} = T_{ambient} + \Delta T_{mylar} + \Delta T_{solar} + \Delta T_{zener} $ $ T_{cell} \approx -56.5°C + 10°C + 5°C + 10°C = -31.5°C $
If successful, this could keep the cells above -40°C, maintaining them in the degraded-but-functional regime rather than the catastrophic regime.
3. Supercapacitor Energy Buffering (Primary Strategy)
Even if thermal management fails and batteries remain at -56.5°C with 8Ω internal resistance, the supercapacitor architecture provides a fallback:
- Trickle charging: Battery provides 0.1-0.2mA continuous (all it can deliver at extreme cold)
- Energy accumulation: Over 5-minute intervals, supercap stores: ( E = 0.15mA \times 2V \times 300s = 90mJ )
- Transmission bursts: LoRaWAN uplink requires ~132mJ per packet
- Challenge: At slowest trickle charge, supercap needs ~7.5 minutes to accumulate enough energy
The supercapacitor decouples the peak power requirement (radio transmission) from the battery’s ability to deliver current. Even at worst-case trickle charge, transmissions can occur every 7-8 minutes rather than the nominal 5 minutes—a graceful degradation rather than complete failure.
4. Low Power Data-Logging Mode (Last Resort)
If thermal management cannot warm the batteries and solar power is insufficient to charge the supercapacitor, Stratosonde enters a power-conservation mode:
Normal Operation:
- GPS position fix every 5 minutes: ~15mA for 3 seconds
- Environmental sensors (pressure, temperature, humidity): ~2mA for 10 seconds
- LoRaWAN transmission: ~100mA for 400ms
- Total energy per cycle: ~200mJ
Low Power Mode:
- GPS position fix: Same (critical for tracking)
- Sensor readings: Same (mission data collection)
- No RF transmission: Data logged to flash memory only
- Total energy per cycle: ~150mJ (25% reduction)
In this mode, the platform continues collecting science data but defers transmission until power is available. Data accumulates in non-volatile memory and is transmitted in batches when:
- Solar angle improves (more power available)
- Battery warms above critical temperature
- Supercapacitor charges to transmission threshold
Recovery Strategy:
The system continuously monitors battery voltage and available power:
$ P_{available} = \frac{(V_{batt} - V_{min})^2}{4 \times R_{batt}} $
When ( P_{available} > P_{transmission} ), the system exits low-power mode and resumes normal operation, uploading the backlog of stored telemetry.
Why This Matters for Long-Duration Missions
A week-long stratospheric flight experiences varying thermal and solar conditions:
Best Case (midday, summer, low latitude):
- Direct solar illumination: 100mW
- Zener heating active: 50mW battery warming
- Battery temperature: -35°C (degraded but functional)
- Normal operation: transmit every 5 minutes
Nominal Case (average day/night cycle):
- Daytime solar: 50mW average
- Passive mylar insulation: -45°C battery temperature
- Supercapacitor buffering: transmit every 5-10 minutes
Worst Case (night, winter, high latitude):
- No solar input, battery at -56.5°C ambient
- Low power mode: log only, no transmission
- Supercap maintains minimal GPS fixes
- Resume transmission at dawn
The multi-layer strategy ensures the platform remains functional across the full range of conditions, degrading gracefully rather than failing catastrophically.
Comparison to Other Battery Chemistries
How does LTO compare to alternatives at extreme cold?
Lithium-Ion (NMC, LiCoO₂):
- Higher energy density: 180-250 Wh/kg vs. 60-80 Wh/kg for LTO
- Worse cold performance: Internal resistance increases 20-50× at -20°C
- Unsafe charging below 0°C (lithium plating → dendrites → short circuit)
- Cycle life: 500-1000 cycles vs. 2000+ for LTO
Lithium Iron Phosphate (LiFePO₄):
- Good energy density: 100-120 Wh/kg
- Better cold tolerance than NMC, worse than LTO
- Safe chemistry, but limited voltage (3.2V nominal)
- Cycle life: 2000+ cycles
Lithium Polymer (LiPo):
- Excellent energy density: 150-200 Wh/kg
- Poor cold performance (worse than Li-ion)
- Safety concerns at low temperature
- Limited cycle life: 300-500 cycles
Primary Lithium (Li-FeS₂, Li-MnO₂):
- Excellent cold capability: operates to -40°C
- High energy density: 200-300 Wh/kg
- Non-rechargeable: mission duration limited to initial capacity
- For Stratosonde: 40mAh would support ~3-4 days maximum
The Verdict: LTO is the best compromise for a solar-rechargeable stratospheric balloon. Yes, it degrades catastrophically below -50°C. But:
- It can be charged at low temperature (critical for solar harvesting)
- Cycle life supports multi-day missions
- Safe chemistry (no thermal runaway)
- The 2S + supercap architecture compensates for cold performance
No battery chemistry truly “works” at -60°C—they all degrade severely. The question is which degrades least while remaining rechargeable.
Design Validation and Margins
The characterization data validates the Stratosonde power architecture margins:
Energy Balance (24-hour cycle at -60°C):
Daytime (12 hours, averaged over day/night):
- Solar input (averaged): 50mW
- BQ25570 harvesting efficiency: 70%
- Battery charging power: 35mW
- Energy harvested: 35mW × 12hr = 420mWh = 1512 J
Nighttime (12 hours):
- Average system load: 20mW (MCU + sensors sleep mode + GPS fixes)
- Transmission load: 330mW × 0.4s × 144 transmissions/12hr = 19.0 J
- Total nighttime consumption: 20mW × 12hr + 19.0 J = 240mWh + 19.0 J = 883 J
Net Balance: $ E_{net} = 1512 J - 883 J = 629 J \text{ surplus} $
Even at -60°C with severely degraded battery performance and the increased power requirements (longer GPS fix time, higher transmission power), the system maintains positive energy balance. The 2S configuration with supercapacitor buffering ensures the battery’s high internal resistance doesn’t prevent charging during the day or discharging at night.
Worst-Case Margin:
If battery degradation is 50% worse than measured:
- Rbatt = 12Ω per cell = 24Ω total for 2S
- Trickle current to supercap: ~8mA
- Supercap charging time for one transmission: ~2 seconds
- Still >100× margin over 5-minute transmission interval
The architecture has deep margins even beyond the characterized conditions.
Next Steps: Cold Chamber Validation
The characterization quantifies individual cell performance, but system-level validation is required:
System Integration Testing (planned):
- Cold Chamber Full System Test
- Complete Stratosonde electronics in thermal chamber
- Battery pack (2S HTC1015) + supercapacitor + buck converter
- BQ25570 solar harvester with simulated solar input
- LoRa radio transmitting realistic message packets
- Temperature profile: +25°C → 0°C → -20°C → -40°C → -60°C
- Duration: 24+ hours at each temperature
- Charge Acceptance at Temperature
- Can the BQ25570 successfully charge the battery at -60°C?
- What is the effective charging current vs. temperature?
- Does cold-temperature charging degrade the cells?
- Long-Duration Cold Soak
- 10+ day test at -60°C with simulated day/night cycles
- Measure capacity retention over multiple freeze/thaw cycles
- Detect any failure modes not apparent in short-term testing
- Thermal Chamber + Vacuum
- Stratosphere is not just cold—it’s also 1% atmospheric pressure
- Does reduced pressure affect heat transfer?
- Battery outgassing at low pressure + low temperature?
- Flight Heritage Test
- Actual balloon flight to 20km+ altitude
- Real-world validation before committing to long-duration mission
- Telemetry includes battery voltage, current, temperature
Each test builds confidence that the characterized performance translates to operational capability.
Conclusion: Physics as Design Constraint
The HTC1015 characterization reveals an uncomfortable truth: battery chemistry doesn’t just degrade at stratospheric temperatures—it approaches a fundamental limit where electrochemical processes become frozen in time.
Below -50°C, the HTC1015 transitions from an energy storage device to an electrochemical curiosity: it contains stored charge, but extracting that charge at useful rates becomes nearly impossible. Internal resistance increases 800× from room temperature to -60°C. A battery that happily provides 800mA continuous discharge at +25°C struggles to sustain 0.2mA at stratospheric cold.
This isn’t a manufacturing defect or a design flaw—it’s physics. Lithium ions cannot hop between lattice sites when thermal energy is insufficient. Liquid electrolytes cannot conduct ions when they’re transitioning to glass. Charge transfer reactions cannot proceed when activation barriers are insurmountable.
The Stratosonde power architecture doesn’t try to defeat physics—it works with the constraints:
- 2S configuration provides voltage margin when individual cells sag under load
- Supercapacitor buffer decouples high-current loads from high-resistance battery
- Buck converter maintains stable 3.3V output across wide input variation
- Solar harvesting enables multi-day missions despite battery limitations
The characterization transforms an unknown (“will batteries work at -60°C?”) into quantified design parameters (“batteries degrade catastrophically, but the architecture compensates”). This data now feeds directly into power budget calculations, mission duration modeling, and thermal management strategy.
Sometimes the most valuable test result is the one that tells you your original plan won’t work—forcing you to engineer a better solution. The HTC1015 temperature characterization did exactly that.
Related Posts
This post is part of the Stratosonde power system characterization series:
- BQ25570 Bench Characterization - Solar energy harvester efficiency testing
- Stratosonde Cascading Power Architecture - The multi-layer power strategy
- Ceramic Capacitor Bank Validation - The final power layer at -70°C
- Optimizing Solar Power - Solar cell characterization and MPPT tuning
Raw characterization data: htc1015_temperature_test.csv
HTC1015 Datasheet: 华慧规格书HTC1015-40(单电芯).pdf