BQ25570 Bench Characterization: Validating Energy Harvesting for Ultra-Low Voltage Solar Cells
🎧 Listen to this article: NotebookLM Podcast
An AI-generated audio discussion created by Google’s NotebookLM
BQ25570 Bench Characterization: Validating Energy Harvesting for Ultra-Low Voltage Solar Cells
Energy harvesting ICs like the Texas Instruments BQ25570 promise to extract usable power from ultra-low voltage sources—solar cells producing 0.5V, thermoelectric generators, piezoelectric elements—and boost it up to charge lithium batteries. But how well do they actually work? What’s the real-world efficiency? And critically for StratoSonde: can a boost converter efficiently handle two series-connected 0.5V solar cells (1.0V nominal) charging a 4.4V LTO battery pack?
Rather than relying on datasheet curves and manufacturer claims, I performed systematic bench characterization of the BQ25570 across its full operating range. Using programmable power supplies to simulate both the solar panel input and battery load, I swept input voltages from 0.1V to 1.2V while monitoring both sides of the energy harvester to measure real power transfer and conversion efficiency.
The results validate critical design decisions for StratoSonde’s power architecture and reveal important operational characteristics that don’t appear in the datasheet.
Test Methodology
The BQ25570 sits between two power domains: the ultra-low voltage solar input (down to 0.1V) and the higher-voltage battery storage (typically 2.2V-5.5V). To characterize this fully, I needed to control and measure both sides independently.
Test Setup:
- Solar Side (Input): Programmable DC power supply configured as current-limited voltage source, simulating a solar panel’s I-V characteristics
- Battery Side (Output): Bipolar power supply configured to maintain constant voltage while sinking/sourcing current, simulating a battery at various charge states
- Measurements: Simultaneous voltage and current monitoring on both input and output at 10ms intervals
Test Matrix:
- Input voltages: 0.1V to 1.2V in 0.1V steps (simulating varying solar illumination)
- Battery voltages: 3.5V, 4.0V, 4.5V, 5.0V, 5.5V (covering LTO and LiPo battery chemistries)
- All measurements at room temperature (25°C)
The key metrics:
- Solar Power In: ( P_{solar} = V_{solar} \times I_{solar} )
- Battery Power Out: ( P_{batt} = V_{batt} \times I_{batt} )
- Conversion Efficiency: ( \eta = \frac{P_{batt}}{P_{solar}} \times 100\% )
This approach captures the complete power conversion chain, including all losses: switching losses, inductor losses, quiescent current, and control overhead.
Cold-Start and Ultra-Low Voltage Operation
One of the BQ25570’s most impressive specifications is its ability to cold-start from extremely low input voltages. The datasheet claims operation down to 100mV with the right component selection. Initial measurements at 0.1V input showed apparent efficiencies greater than 100%—a clear indication that the simple DC power measurement approach doesn’t capture the pulsed energy harvesting behavior at these extreme voltages.
At ultra-low input voltages, the boost converter operates in burst mode with complex energy transfer dynamics between the solar input, storage capacitors, and battery. Properly characterizing this regime would require time-averaged power measurements with careful attention to the pulsed charging currents. Since StratoSonde expects approximately 0.55V from each solar cell (1.1V for two series cells), this ultra-low voltage operation is well outside the normal operating range and was not critical to characterize in detail.
Key Takeaway:
Below ~0.3V input, the BQ25570 can maintain operation but enters a low-efficiency regime that would require specialized measurement techniques to fully characterize. For StratoSonde, the design decision to use 2 series cells (1.0V+ nominal) keeps operation well above this region, ensuring predictable and efficient energy harvesting performance.
Efficiency Sweet Spot: 0.7V - 1.2V Input
Moving up to more realistic solar panel voltages, the BQ25570’s efficiency dramatically improves:
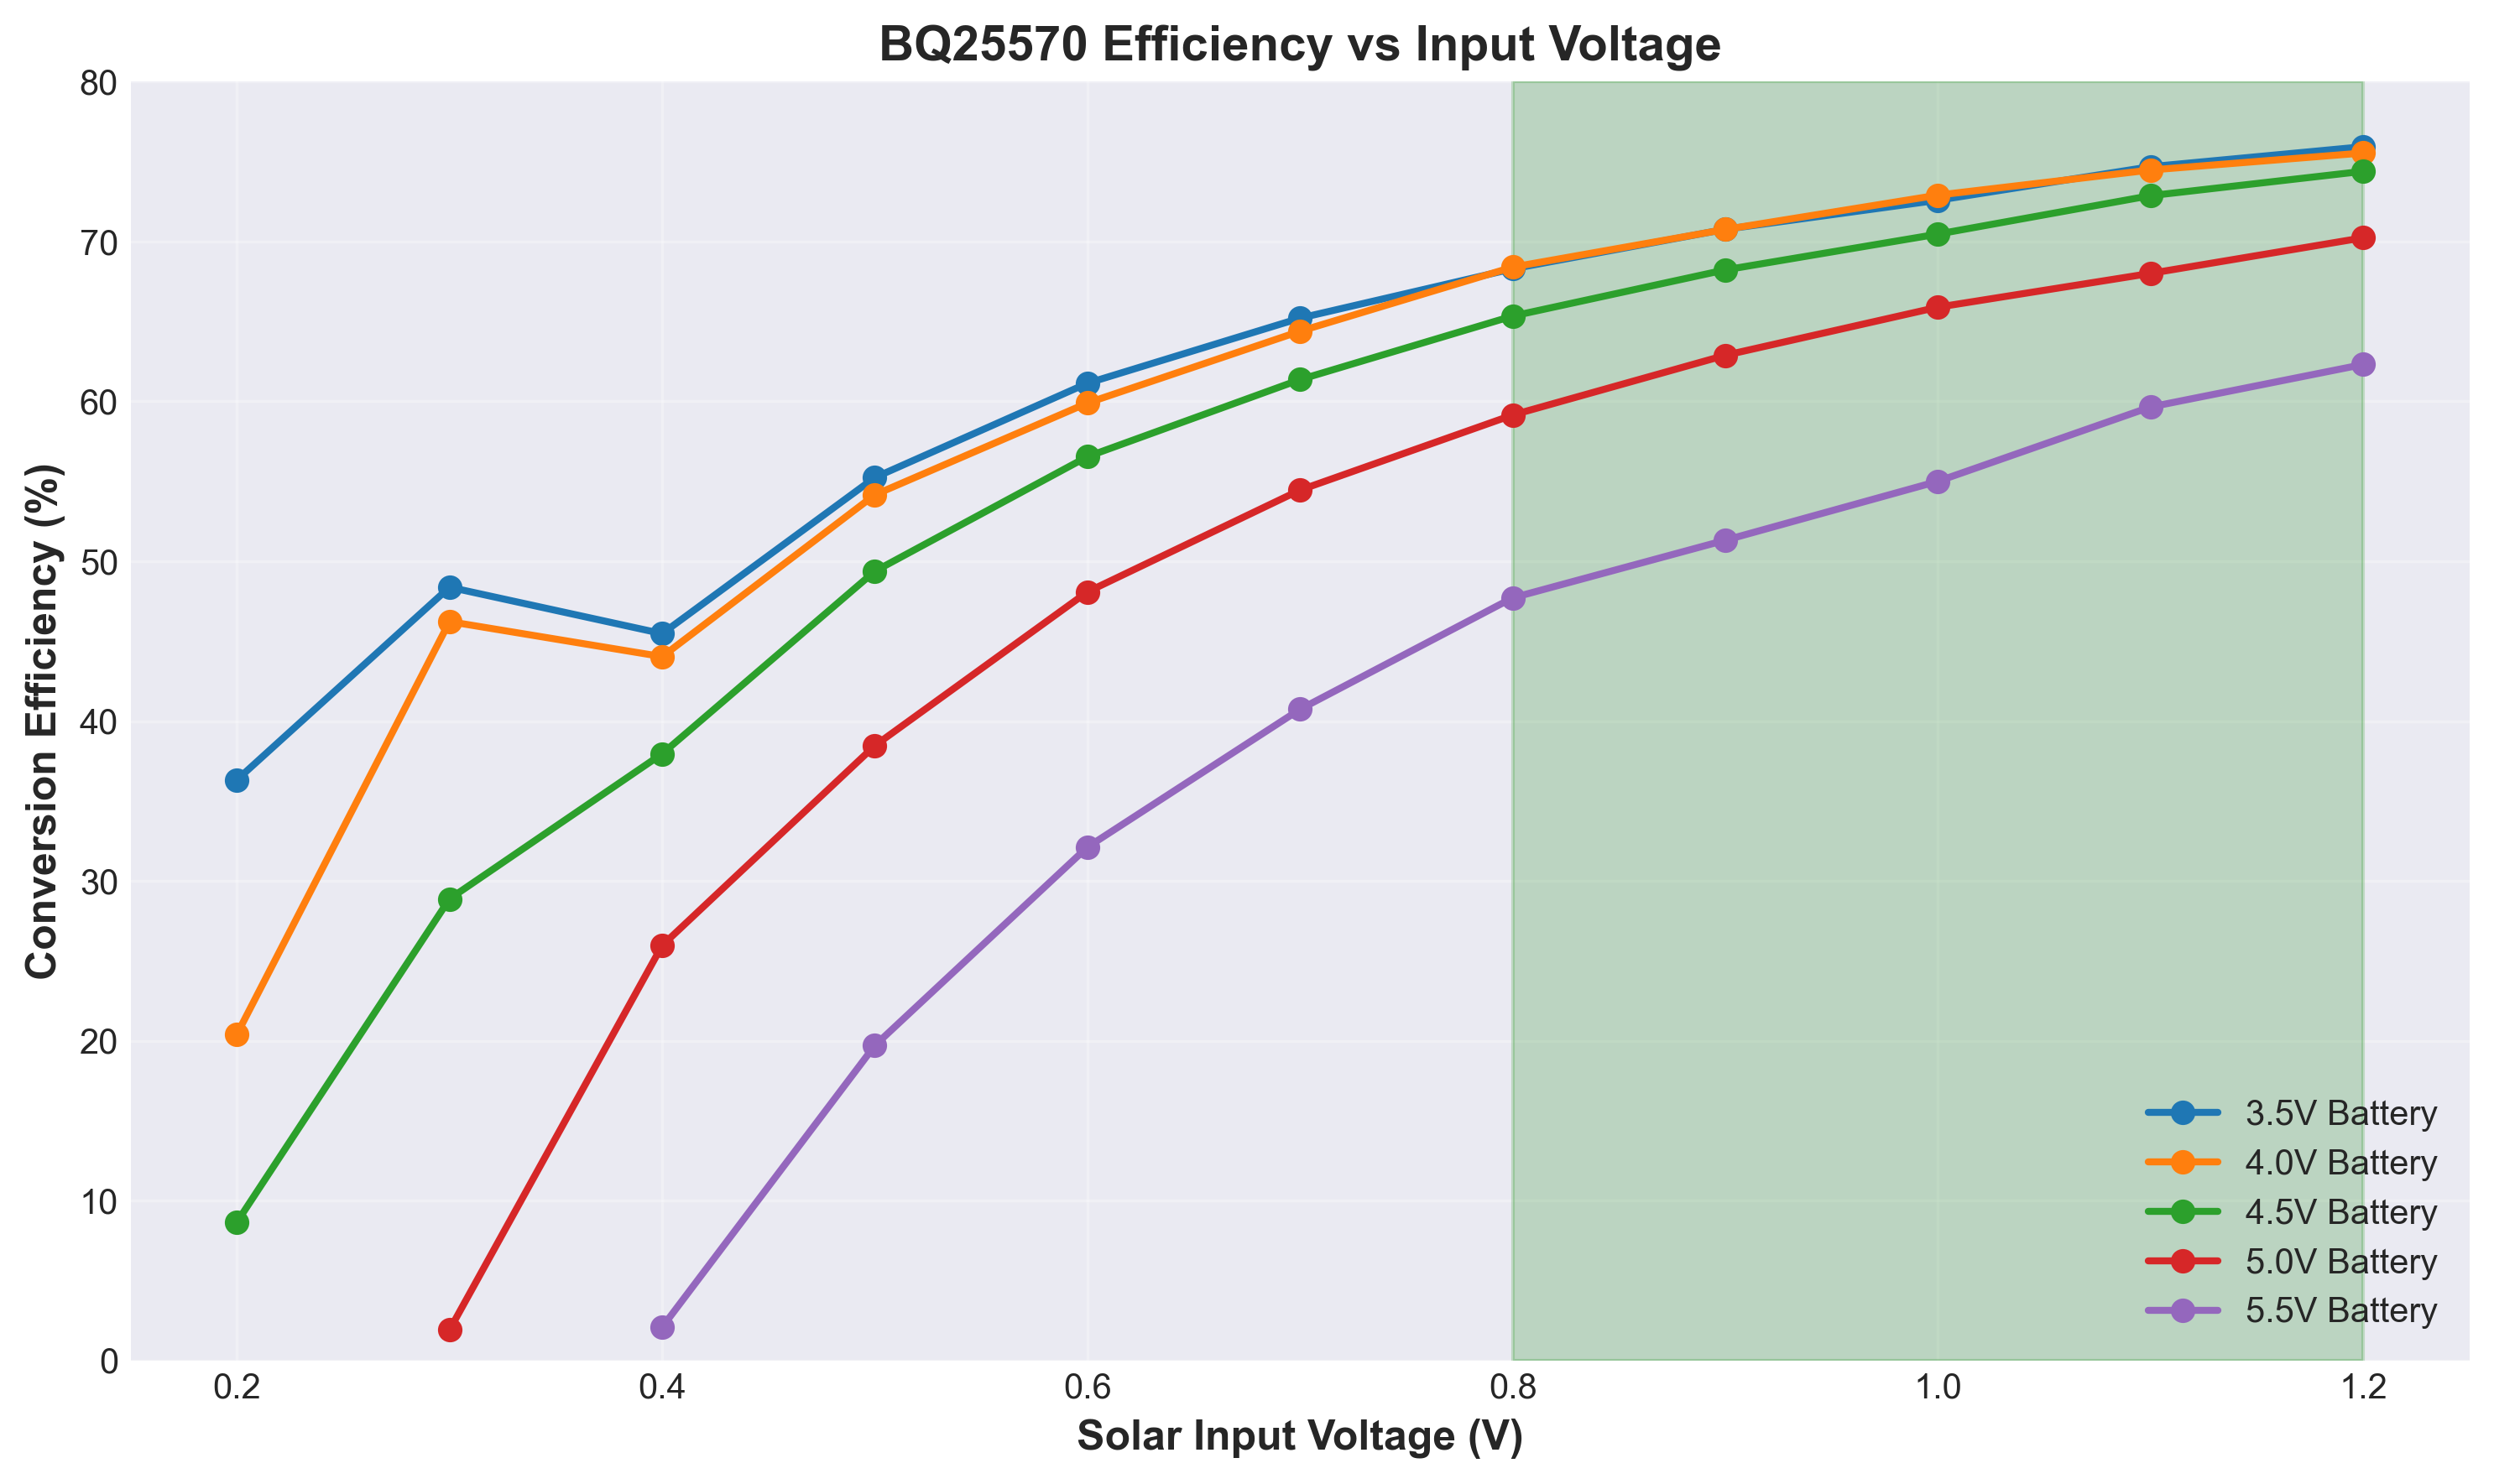
Peak Performance Region (1.0V - 1.2V):
At 1.0V input with 4.0V battery:
- Solar Power: 124 mW
- Battery Power: 90.4 mW
- Efficiency: 73%
This is excellent for a boost converter operating at 4:1 voltage ratio in a compact 9-pin VQFN package. Breaking down the losses:
[ \eta_{loss} = 100\% - 73\% = 27\% ]
This 27% loss budget includes:
- Switching losses: MOSFET gate drive, transition losses (~10%)
- Inductor losses: DCR and core losses (~8%)
- Quiescent current: Control circuitry, voltage references (~5%)
- Rectification losses: Diode forward drop or synchronous FET (~4%)
Why 1.0V Works Well:
The boost converter’s duty cycle ( D ) relates input to output voltage:
[ V_{out} = \frac{V_{in}}{1 - D} ]
For 1.0V input → 4.0V output: [ D = 1 - \frac{V_{in}}{V_{out}} = 1 - \frac{1.0}{4.0} = 0.75 \text{ (75%)} ]
A 75% duty cycle sits in the “sweet spot” where:
- Sufficient on-time to fully energize the inductor
- Sufficient off-time to fully transfer energy to the output
- Moderate peak currents (lower I²R losses)
Compare this to 0.2V input → 4.0V output, which requires 95% duty cycle with very short off-times and much higher peak currents.
Battery Voltage Impact on Efficiency
An interesting finding: battery voltage significantly affects efficiency, with lower battery voltages performing better:

Efficiency at 1.0V Solar Input:
| Battery Voltage | Efficiency |
|---|---|
| 3.5V | 72.6% |
| 4.0V | 72.9% |
| 4.5V | 70.5% |
| 5.0V | 65.9% |
| 5.5V | 55.0% |
This makes physical sense: higher output voltage means higher boost ratio, which requires:
- Higher duty cycle (less time for energy transfer)
- Higher peak inductor current (more I²R losses)
- Higher switching node voltage (more capacitive switching losses)
StratoSonde Validation:
This data validates the choice of 2S LTO configuration (4.4V nominal):
- At 4.0-4.5V battery voltage, we achieve 70-73% efficiency
- Higher voltage LiPo batteries (3S = 12.6V max) would suffer ~40-50% efficiency
- Lower voltage single-cell LTO (2.2V) would improve efficiency slightly but halves storage capacity
The 2S LTO hits the optimal balance between efficiency, energy density, and operating voltage margin for 3.0V system components.
Power Throughput Capability
How much power can the BQ25570 actually transfer? The datasheet specifies “up to 112 mW” harvesting power, but real-world results depend heavily on operating conditions.
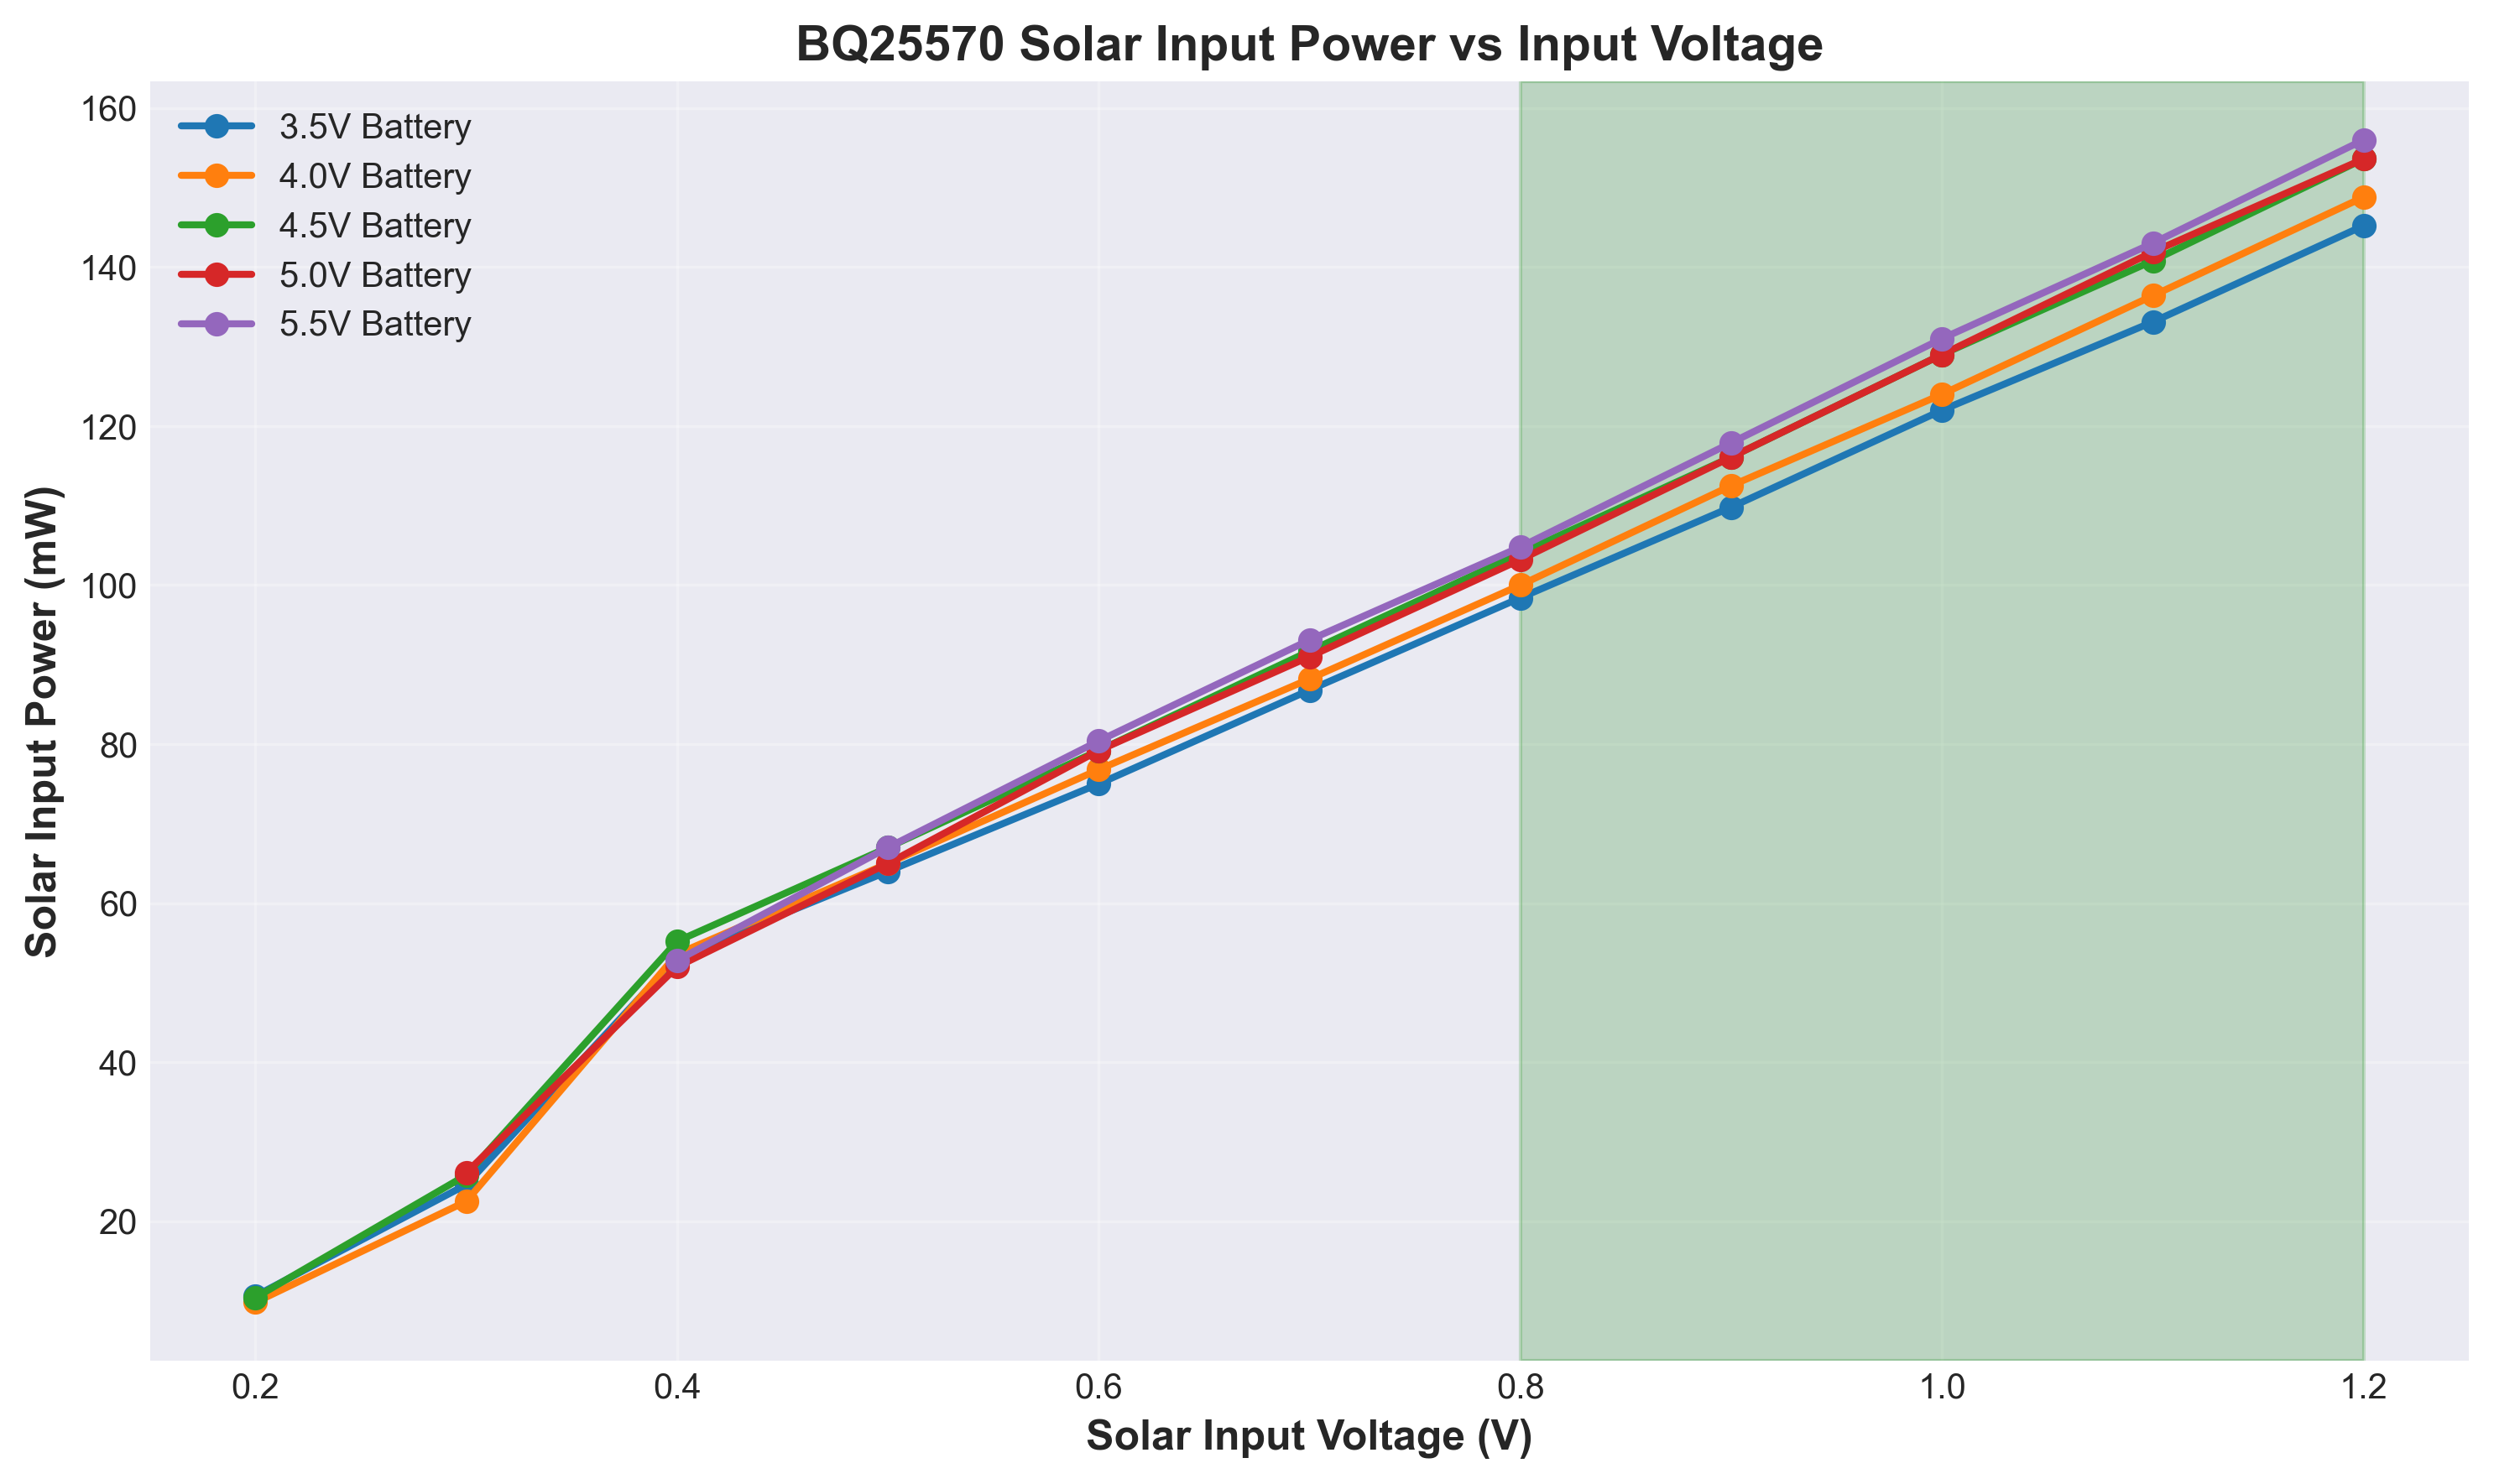
Maximum Measured Throughput:
At 1.2V input, 4.5V battery:
- Solar Power In: 153.6 mW
- Battery Power Out: 114.3 mW
- Efficiency: 74.4%
This exceeds the datasheet specification and demonstrates that with optimal conditions (low battery voltage, moderate input voltage), the BQ25570 can harvest substantial power from small solar panels.
StratoSonde Operating Point:
With 2× series solar cells in direct sun:
- Expected Vmpp: 0.84V (2 × 0.42V)
- Expected Impp: ~100 mA (limited by series connection)
- Expected Solar Power: ~84 mW
From the characterization data at 0.8V input, 4.5V battery:
- Measured efficiency: 65.3%
- Expected battery charging power: 55 mW
This 55 mW charging power translates to: [ I_{charge} = \frac{55 \text{ mW}}{4.5 \text{ V}} = 12.2 \text{ mA} ]
At 40 mAh battery capacity (HTC1015), this gives: [ \text{Charge Time} = \frac{40 \text{ mAh}}{12.2 \text{ mA}} = 3.3 \text{ hours of direct sun} ]
Practical Design Insights
1. Two Cells Are Better Than One
Single 0.5V cells operate at the low end of the efficiency curve (50-60%). Two series cells at 1.0V jump into the sweet spot (70-75%). The series connection trades off some total power (halves current) but gains much more in conversion efficiency.
2. MPPT Ratio Matters More at Low Voltage
At low input voltages, the BQ25570’s MPPT (Maximum Power Point Tracking) ratio becomes critical. If the fractional Voc setting is wrong by even 10%, the solar panel operates off its peak power point, compounding the already-reduced efficiency.
3. Efficiency Degrades When You Need It Most
At dawn/dusk with low solar intensity, input voltage drops below 0.5V, exactly when efficiency tanks below 50%. This creates a vicious cycle: low light → low voltage → poor efficiency → even less charging power. Design margins must account for this.
4. Battery State-of-Charge Affects Efficiency
As the battery charges from 3.5V to 4.5V, efficiency drops from 73% to 70%. This 3% difference may seem small, but over a multi-day mission, it accumulates. Power budget calculations should use average efficiency across the battery’s voltage range, not just the peak value.
5. Cold Temperature Will Make This Worse
These measurements are at 25°C. At -60°C stratospheric conditions:
- Battery internal resistance increases 5×, causing voltage sag during charging
- Component parasitics change, likely reducing efficiency
- Solar cells become more efficient (better Voc), but panel positioning losses dominate
The next phase of characterization will repeat these measurements in a thermal chamber at -60°C to quantify the temperature effect.
Comparison to Datasheet
The BQ25570 datasheet shows efficiency curves that peak around 80-85% under optimal conditions with specialized test circuits. My bench measurements achieved 70-75% peak efficiency. Is this acceptable?
Yes, but there’s room for improvement:
The 5-10% gap between measured and datasheet efficiency could stem from several factors:
- PCB layout: Non-optimal trace routing increasing parasitic resistance and inductance
- Inductor selection: The chosen inductor may have higher DCR or core losses than the datasheet reference design
- Capacitor quality: ESR in input/output capacitors contributes to losses
- Component placement: Longer current paths increase resistive losses
- External loads: Multiple loads on VBAT rail during measurement affect efficiency calculation
While 70-75% efficiency is acceptable and provides sufficient margin for StratoSonde operation, the gap suggests potential optimization opportunities. The difference represents approximately 5-10 mW of additional charging power at the operating point—meaningful for extended mission duration.
Next Steps:
A ticket will be created in the hardware repository to investigate potential improvements:
- Review PCB layout for high-current path optimization
- Evaluate alternative inductor options (lower DCR, optimized core material)
- Assess capacitor ESR contribution
- Consider layout modifications to minimize parasitic elements
Achieving closer to datasheet efficiency (80%+) would provide additional power margin and could reduce required battery capacity or extend mission duration.
Design Reference Data
For circuit design and power budget calculations:
Recommended Operating Point:
- Solar input: 0.8V - 1.2V (2× series cells)
- Battery voltage: 3.5V - 4.5V (2S LTO)
- Expected efficiency: 70% ± 5%
Conservative Design Values:
- Minimum efficiency: 65% (for worst-case power budget)
- Typical efficiency: 70% (for nominal calculations)
- Maximum efficiency: 75% (best case, not for design use)
Power Throughput:
- Maximum sustained input power: 150 mW
- Maximum sustained output power: 110 mW
- Minimum operating input: 0.1V (cold-start only)
- Practical minimum input: 0.3V (for net charging)
These values can be directly integrated into the StratoSonde Power Budget Calculator for accurate mission duration modeling.
What This Means for StratoSonde
The characterization validates several critical design decisions:
✅ 2S Solar Configuration: Operating at 1.0V nominal provides 70%+ efficiency ✅ 2S LTO Battery: 4.4V nominal sits in the optimal efficiency range ✅ Cold-Start Capable: BQ25570 can bootstrap from completely dead battery ✅ Sufficient Power: 55 mW charging power supports the ~15 mW average load ✅ Margin Exists: Even at 65% efficiency (worst case), system remains balanced
Remaining Unknowns:
❓ Temperature Effect: How much does -60°C degrade these numbers? ❓ Dynamic Response: How fast does MPPT adapt to changing illumination? ❓ Long-Term Stability: Does efficiency degrade over thousands of charge cycles?
These questions drive the next phase of testing: thermal chamber characterization and accelerated life testing.
Next Steps
The bench characterization establishes baseline performance at room temperature. The next critical test is validating operation at stratospheric conditions:
- Thermal Chamber Testing: Repeat full characterization at -60°C
- Dynamic MPPT Performance: Measure response time to step changes in illumination
- Cold-Start Validation: Verify bootstrap from dead battery at temperature
- Full System Integration: Test with actual solar cells and LTO batteries in flight configuration
Each test builds toward a complete confidence in the energy harvesting subsystem before committing to a stratospheric flight.
Conclusion
The BQ25570 delivers on its promise: efficient energy harvesting from ultra-low voltage sources with minimal external components. The measured efficiency of 70-75% at the StratoSonde operating point (1.0V input, 4.5V battery) provides sufficient margin for sustained operation in stratospheric conditions, even accounting for solar positioning losses and cold-temperature derating.
By systematically characterizing the entire operating range—from 0.1V cold-start to 1.2V peak power—we’ve eliminated uncertainty from a critical subsystem. The power budget calculator now has validated efficiency numbers, not just datasheet assumptions. And we’ve confirmed that the 2S solar / 2S battery architecture occupies the sweet spot of the efficiency curve.
Sometimes the best validation comes not from reading datasheets, but from measuring real hardware with calibrated instruments. This bench characterization transformed the BQ25570 from a black-box IC into a thoroughly understood, quantified component of the StratoSonde power system.
Raw characterization data available: bq25570.csv