Balloon Inflation Testing: From Swing Arm to Strain Map
Balloon Inflation Testing: From Swing Arm to Strain Map
The Balloon Float Calculator post established the physics of superpressure flight: a mylar balloon inflated with helium reaches a float altitude where buoyancy equals weight, and the pressure differential across the envelope determines whether it survives or bursts. The calculator treats burst pressure as a single number — typically ~4.8 kPa (0.7 PSI) for mylar superpressure balloons.
But that number is a fiction. Or rather, it’s a population average that hides enormous variation. Different balloon brands, sizes, material thicknesses, seam geometries, and even batches from the same manufacturer produce wildly different burst pressures. Some balloons develop pinhole leaks long before reaching their theoretical burst limit. Others stretch unevenly, concentrating strain at seams until a single gore fails catastrophically.
The picoballoon community knows this intimately. Early flight failures are common, and a significant fraction trace back to envelope integrity rather than payload or gas management problems. Prestretching — inflating the balloon on the ground before flight — has become standard practice, primarily to find pinholes before they find you at 40,000 feet. But there’s a deeper question the community has been discussing: does prestretching on the ground actually prepare the material for conditions at altitude? At −70°C in the stratosphere, mylar behaves differently than at room temperature. Some argue that ground-level prestretching is essential not just for leak detection but for working the material through its initial plastic deformation where it’s warm enough to yield gracefully, rather than having that first stretch happen at cryogenic temperatures where the material is brittle.
These are empirical questions that require data. This post describes the test infrastructure I’ve built to collect that data systematically.
Why Measure, Not Just Inflate?
The simplest prestretch protocol is: inflate the balloon, look for leaks, deflate, fly. Many successful flights have used exactly this approach. But if you want to select the best balloon material and design for long-duration superpressure flights, you need to know more:
- At what pressure does the material start creeping? Creep — slow, continuous deformation under constant load — determines whether your balloon will gradually stretch to failure over days of flight.
- Where does strain concentrate? Seams, gore intersections, and material defects create stress concentrations. Knowing where they are before flight lets you design around them.
- How does a second inflation compare to the first? If ground prestretching changes the material’s mechanical response, the flight envelope effectively starts from the prestretched state. Understanding how first and second inflation differ quantifies the prestretching effect.
- What’s the actual failure mode? Does the material burst at a seam? Develop pinholes? Delaminate? Each failure mode suggests different design improvements.
To answer these questions, I built a three-stage pipeline: inflate the balloon under controlled conditions while measuring pressure and geometry, capture the surface deformation with stereo cameras, and analyze the resulting data to produce quantitative strain maps and creep metrics. The results feed into a public catalog where anyone can compare balloon types.
The Inflation Rig
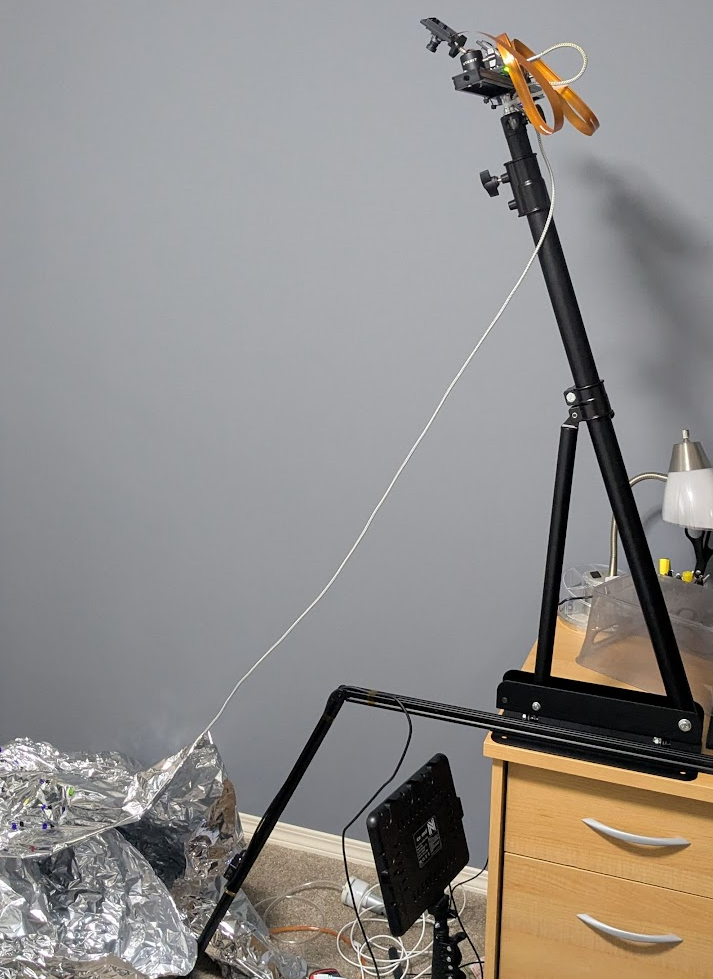 The complete test setup: swing arm with IMU inclinometer for diameter measurement, dual stereo cameras for surface strain capture, and relay-controlled pump for automated pressure stepping.
The inflator is a Raspberry Pi-based control system that manages the entire inflation process. The physical setup is straightforward: the balloon sits on the ground at the end of a shaft that pivots at a fixed height above the floor. As the balloon inflates and grows taller, the shaft tilts — and a WT901B IMU mounted on the shaft measures that pitch angle change.
The geometry is simple trigonometry. From a two-point calibration (shaft angle at a known low height and a known high height), the system derives the shaft length and continuously converts pitch angle to balloon height, diameter, and circumference. A GT5101 USB barometer measures the differential pressure inside the balloon. A relay-controlled air pump handles inflation.
The key capability is the automated pressure-stepping creep test. Rather than inflating continuously to burst, the rig increments pressure in small steps (typically 0.025 PSI), holds each pressure level for a configurable period (5–10 minutes), and measures whether the balloon continues to stretch at constant pressure — that’s creep. The web dashboard shows real-time plots of circumference, pressure, height, diameter, and the dP/dC derivative that indicates how the balloon’s compliance is changing.
| Parameter | Typical Setting |
|---|---|
| Pressure start | 0.10 PSI |
| Pressure step | 0.025 PSI |
| Hold duration | 5–10 minutes per step |
| Safety cutoff | Circumference or max pressure limit |
| Sample rate | 5 Hz |
| Ambient monitoring | Temperature, humidity, barometric pressure |
A single test run often spans 8–35 hours. These aren’t quick spot checks — they’re characterization runs that map the full pressure-diameter response of the material.
Stereo Vision Capture
Knowing pressure and overall diameter is useful but doesn’t tell you where the balloon is stretching. For that, I use full-field surface deformation measurement — the same technique used in aerospace structural testing, known as Digital Image Correlation (DIC).
The capture system is a second Raspberry Pi 5 running dual OV9281 global-shutter monochrome cameras. These cameras were chosen specifically for their global shutter (no rolling-shutter distortion during rapid events like burst) and their 1280×800 resolution at up to 120 fps. Each camera writes to its own NVMe drive to sustain the data rate.
During inflation, the system captures lossless stereo still pairs every 5 seconds, each tagged with the current sensor data from the inflator’s API (pressure, diameter, pump state, angles). Between stills, a high-speed circular RAM ring buffer records continuously at 120 fps.
Burst detection watches the inflator’s diameter signal. When diameter drops more than 5 inches or 30% from its peak — the balloon has burst — the system dumps the ring buffer to disk as MJPEG video. This captures approximately 15–20 seconds of pre-burst and post-burst footage at full frame rate, preserving the failure event even though nobody was watching when it happened at 3 AM.
The cameras are stereo-calibrated using a Charuco board and a web-based calibration tool. Calibration produces the intrinsic and extrinsic parameters needed to reconstruct 3D geometry from the stereo image pairs.
The Analysis Pipeline
The analysis runs offline on a workstation after transferring data from the capture Pi. It’s a multi-stage pipeline built around DIC principles — tracking surface features across frames to measure full-field deformation without contact sensors.
3D Reconstruction
Stereo image pairs are processed through NVIDIA FoundationStereo to generate dense depth maps. Each tracked surface point is then reprojected from 2D image coordinates to 3D world coordinates using the stereo calibration parameters.
 Left: rectified camera image of a dotted balloon during inflation. Right: NVIDIA FoundationStereo depth reconstruction showing the 3D surface geometry.
Surface Strain
A Delaunay triangulation creates a mesh connecting the tracked surface points. For each triangle, the deformation gradient F is computed between the reference frame and the current frame. From F, the Green–Lagrange strain tensor gives the principal strains (ε₁, ε₂) and the areal strain (how much each surface element has grown). Before computing strain, the Kabsch algorithm removes rigid-body motion (camera drift, balloon sway) so that only genuine surface deformation remains.
The catalog reports both the global average strain across all tracked points and individual point strain histories, so you can see both the bulk material behavior and localized hotspots — seams, defects, or areas of strain concentration that might predict failure.
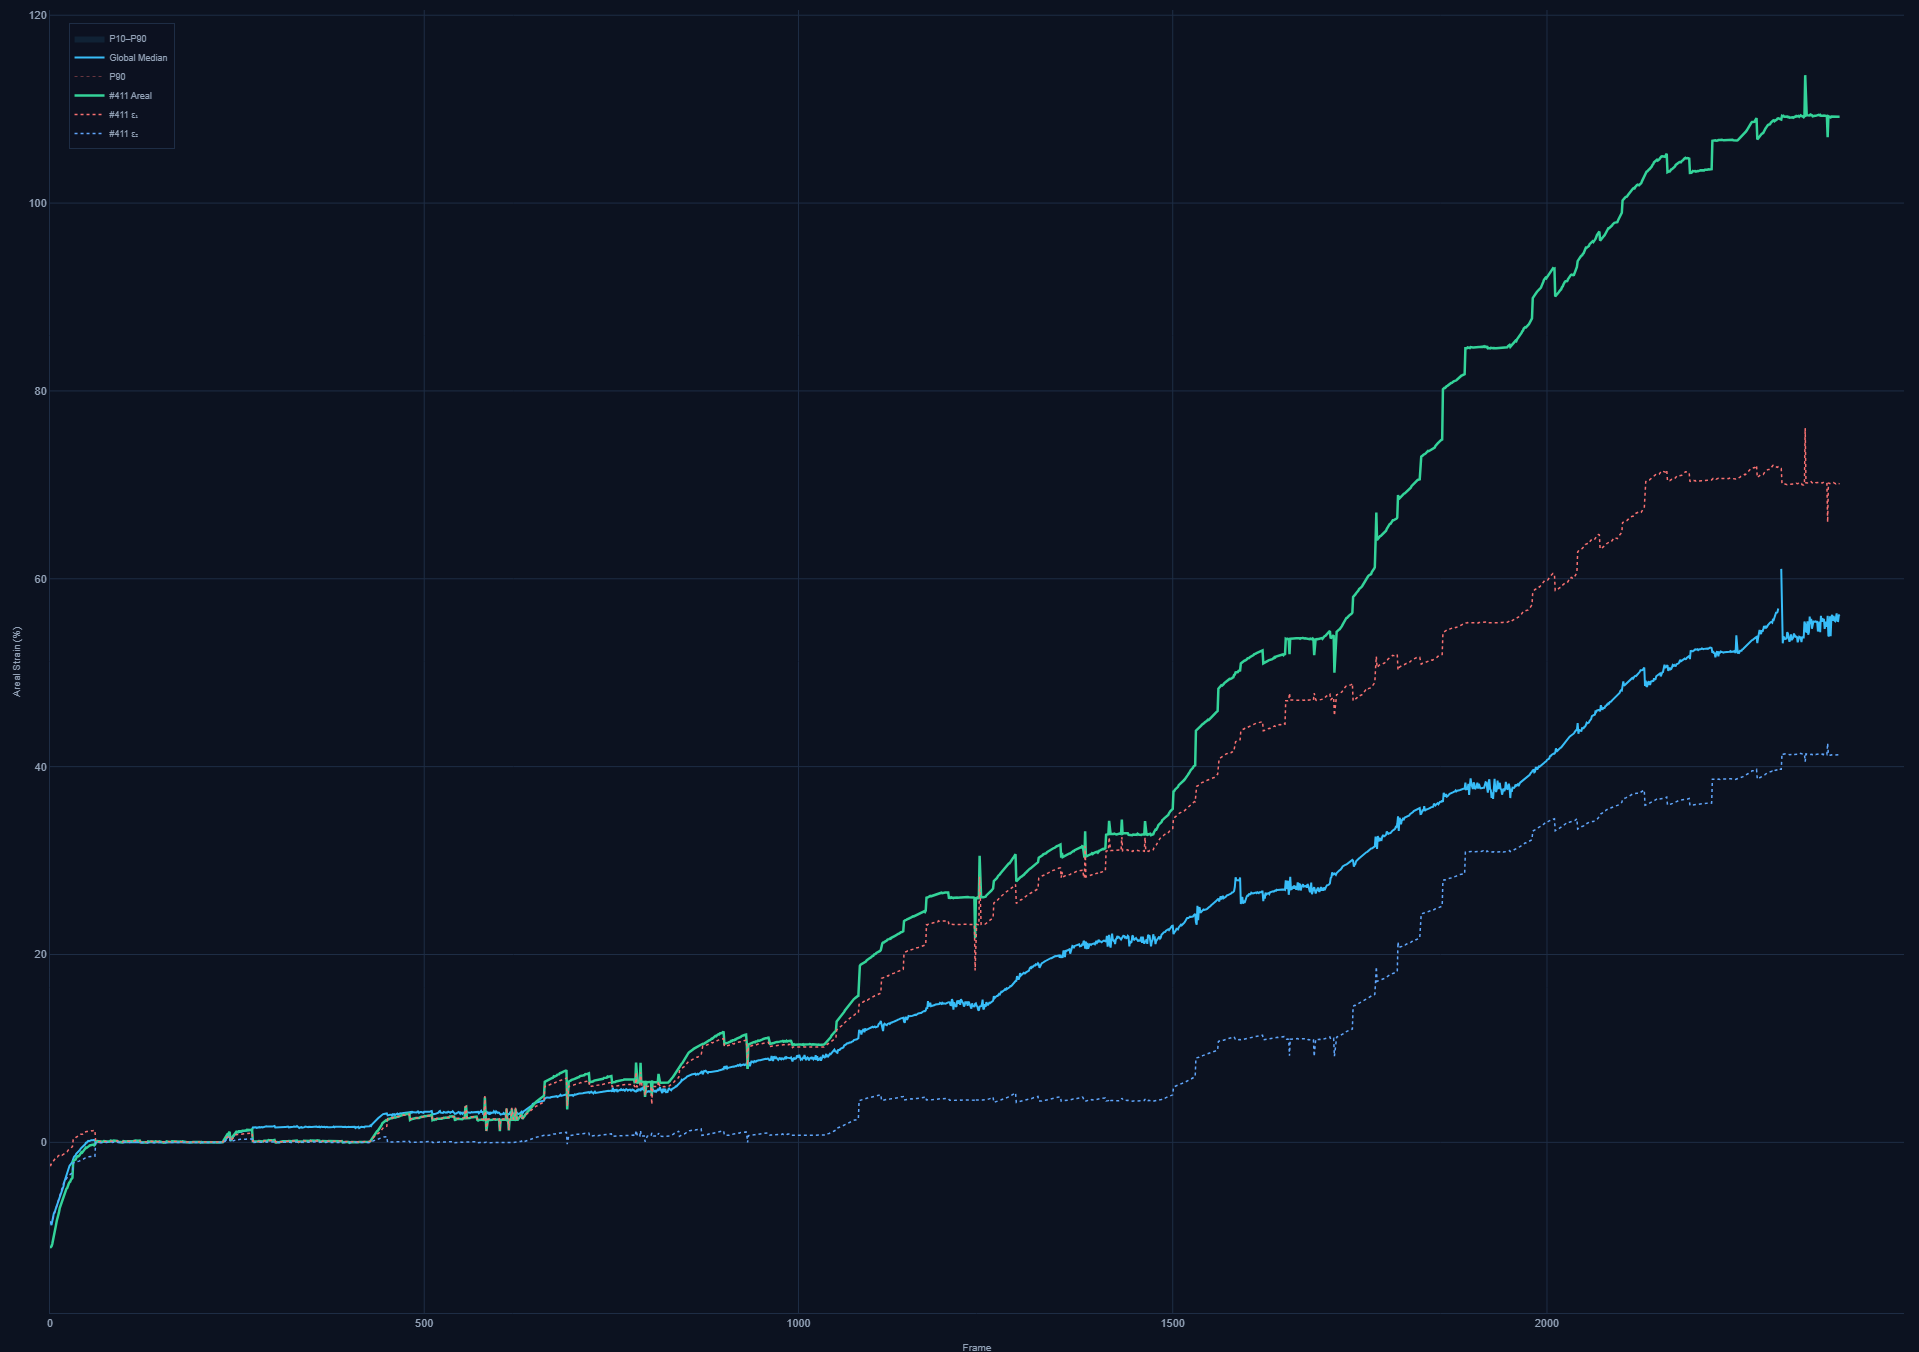 Strain versus pressure: the global average (blue) shows the bulk material response, while a single tracked point (orange) reveals localized strain concentration — in this case at a gore seam.
Plateau Segmentation & Creep
The pipeline identifies constant-pressure hold periods from the inflator data, then computes creep metrics for each: diameter creep rate via Theil–Sen robust regression, and strain creep rate from the slope of median and 90th-percentile areal strain versus time.
The output is a comprehensive dataset: 3D track histories, per-triangle and per-vertex strain timeseries, plateau creep summaries, and diagnostic plots. The pipeline then exports everything into the format consumed by the catalog.
The Balloon Catalog
All of this flows into the Balloon Strain Lab — a public interactive catalog hosted on GitHub Pages:
The catalog currently contains five entries from my first round of testing:
| # | Balloon | Size | Weight | Max Pressure | Max Diameter | Duration | Notes |
|---|---|---|---|---|---|---|---|
| 1 | Silver 4-Gore | 50″ | 50.0 g | 0.56 PSI | 34.8″ | 2.1 hr | 26 µm material |
| 2 | Gold 4-Gore | 60″ | 121.7 g | 0.52 PSI | 47.5″ | 5.9 hr | 32 µm material |
| 3 | Silver 4-Gore | 60″ | 67.7 g | 0.35 PSI | 39.3″ | 12.7 hr | Pinhole leak failure — never reached burst |
| 4a | Cymlar | 60″ | 72.4 g | 0.40 PSI | 40.3″ | 34.7 hr | First inflation, inflator data only |
| 4b | Cymlar | 60″ | 72.4 g | 0.52 PSI | 40.3″ | 8.6 hr | Re-inflation of same balloon, full DIC |
Balloon weight matters for flight planning — it directly determines how much helium is needed and the resulting free lift. The Gold 4-Gore at 121.7 g is more than twice the weight of the Silver 50″ at 50.0 g, which significantly impacts payload budget for a superpressure flight.
Each entry in the catalog provides:
- Overview — balloon specs, test conditions, protocol, conclusions
- Photo gallery — packaging, pre-inflation, inflated, failure details
- DIC strain field viewer — interactive heatmap with a frame scrubber showing strain evolution across the full test. You can switch between areal strain, major principal strain (ε₁), and minor principal strain (ε₂)
- Plots — pressure vs. time, diameter vs. time, diameter vs. pressure, creep rates, strain rate distributions
- Plateau data — per-step summary of pressure, diameter, and creep rates
- Comparison table — side-by-side sortable data across all tested balloons
Early Findings
Even with only five entries, patterns are emerging.
Pinhole Leaks Are a Real Failure Mode
The Silver 4-Gore 60″ test (entry 3) never reached burst pressure. At 0.35 PSI — well below the expected burst limit — multiple pinhole leaks developed and the test was stopped. The strain analysis shows surface deformation up to the point of test termination, but the balloon simply couldn’t hold pressure. This is exactly the failure mode that ground-based prestretching is designed to catch before flight.
Virgin vs. Pre-stretched Material Behaves Differently
The Cymlar 60″ tests (entries 4a and 4b) are the same physical balloon, inflated twice. The first inflation (4a) stopped at 0.40 PSI over 35 hours. The re-inflation (4b) reached 0.52 PSI over 8.6 hours. Comparing the two at matching pressures reveals how the first stretch permanently changes the material’s mechanical response — the pressure-diameter curve shifts, compliance changes, and the creep behavior at each pressure plateau is different. This is direct evidence for why the picoballoon community’s prestretch practice has value beyond just leak detection: you’re fundamentally conditioning the material.
The Prestretch Debate: Ground vs. Altitude
The community discussion about whether to prestretch on the ground (at ~20°C) versus letting the first real stretch happen at altitude (−70°C) is one of the questions this test infrastructure was built to investigate. At cryogenic temperatures, mylar becomes more brittle — its yield strength increases but its elongation at break decreases. A balloon that stretches gracefully through its initial plastic deformation on a warm workbench might crack or develop pinholes if that same deformation first occurs in the stratosphere.
The Cymlar data shows the magnitude of the virgin-to-prestretched transition: the first inflation fundamentally reconfigures the material’s stress-strain response. Whether it’s better to have that transition happen at room temperature (where the material is more ductile) or never happen at all (by designing within the virgin material’s elastic limit at −70°C) is a question the catalog will help answer as I accumulate more test data.
Material Thickness Matters (Obviously, But By How Much?)
The 26 µm silver and 32 µm gold materials show noticeably different pressure-diameter curves, even at the same nominal gore geometry. The catalog’s comparison table makes these differences quantitatively visible rather than anecdotal.
What’s Next
The immediate roadmap is straightforward: inflate more balloons. The catalog infrastructure — from rig to cameras to analysis to publication — is operational and largely automated. Each new test takes a day or two of inflation time, a few hours of analysis, and a git push to update the live site.
Specific testing priorities:
- Repeated inflation cycling — Inflate and deflate the same balloon 5–10 times to characterize fatigue and track how pinhole probability evolves with cycles
- Seam-specific strain analysis — Use the DIC data to quantify strain concentration factors at gore seams versus mid-panel, across different balloon constructions
- More materials — The catalog currently covers standard 4-gore mylar and Cymlar. Expanding to other commercially available envelope materials will build the comparison dataset the community needs
Try It
The catalog is live and public:
Select a balloon test from the dropdown, explore the strain field viewer, scrub through frames to watch strain develop as pressure increases, and compare results across different tests in the comparison table. Every data point comes from a real balloon, inflated under controlled conditions, with stereo-vision strain analysis that goes far beyond “it burst at X PSI.”
If you’re building picoballoons and have opinions about which balloons to test next, or if you have flight data on balloon types that would be useful to correlate with ground test results, I’d welcome the input.
Related Posts
- Balloon Float Calculator — The physics of superpressure balloon flight and why burst pressure matters
- First Hardware Arrives — Early hardware and project direction
- Welcome to Stratosonde — Project overview and goals