Stratosonde Cascading Power Architecture: Engineering for Graceful Degradation at -60°C
🎧 Listen to this article: NotebookLM Podcast
An AI-generated audio discussion created by Google’s NotebookLM
Stratosonde Cascading Power Architecture: Engineering for Graceful Degradation at -60°C
In aerospace power systems design, the conventional approach is to select a single power source and design everything around its limitations. Solar panels for satellites. Primary batteries for sounding rockets. RTGs for deep space probes. Each application uses one answer.
Stratosonde requires a different philosophy: a cascading power architecture where four distinct power sources work in concert, each compensating for the others’ temperature-dependent limitations. This isn’t redundancy—it’s a deliberately engineered power cascade where each layer activates when the previous layer approaches its physical limits.
The challenge is unforgiving: maintain operation across the full envelope from +25°C ground conditions through -60°C stratospheric temperatures, with power sources that individually fail catastrophically across this range. The solution is a four-layer system where solar panels, LTO batteries, supercapacitors, and ceramic capacitors each fulfill specific roles dictated by physics, not preference.
This post documents the engineering rationale, test data, and operational strategy for a power system designed to degrade gracefully rather than fail catastrophically.
The Problem: No Single Power Source Works
At stratospheric temperatures, every conventional power storage technology encounters fundamental physical limits:
LTO Batteries (characterized previously):
- Room temperature: 0.75 mΩ internal resistance, 800mA capability
- -40°C: 9.88 mΩ resistance, barely usable
- -60°C: 8000 mΩ resistance, effectively non-functional
Supercapacitors (this post):
- Room temperature: <100 mΩ ESR, excellent pulse current capability
- -55°C: degraded but functional
- -60°C: catastrophic ESR increase, voltage collapse under load
Ceramic Capacitors:
- Temperature stable down to -65°C
- But: microfarad-scale capacitance, millisecond-duration energy storage only
Solar Panels:
- Excellent power-to-weight ratio
- But: zero output at night, reduced output at steep angles
The question isn’t “which power source should we use?” It’s “how do we architect a system where failure of any one component doesn’t mean mission failure?”
Power Architecture Overview: The Cascade Strategy
The Stratosonde power system uses four layers, each with a defined role:
| Power Source | Primary Function | Operating Regime | Why Used | How Used |
|---|---|---|---|---|
| Solar Panels | Primary energy harvesting | Daytime only | Free power with lightweight cells | Charge 2S LTO battery via BQ25570. Excess power shunted to Zener diodes thermally coupled to LTO cells for battery warming. |
| LTO Batteries (2S) | Medium-term energy storage | +25°C to -40°C optimal -40°C to -60°C degraded |
Store solar energy for nighttime/high-current use. Can charge at low temperature. | Provide instantaneous power accumulated from solar to run radio transmissions. Switch to trickle charging of supercapacitor below -40°C. |
| Supercapacitor (5.5V) | High-current buffer | -40°C to -60°C | Delivers burst current when LTO internal resistance too high | Charged slowly by LTO (trickle mode), discharges rapidly during transmission bursts. Decouples high-current loads from high-resistance battery. |
| Ceramic Capacitors (bank) | Emergency pulse power | Below -60°C | Only power source functional below -60°C | Provides enough energy for minimal LoRaWAN transmission (SF7, shortest packet). Charged by supercapacitor over extended periods. Enables degraded-mode periodic transmissions even when all other sources struggle. |
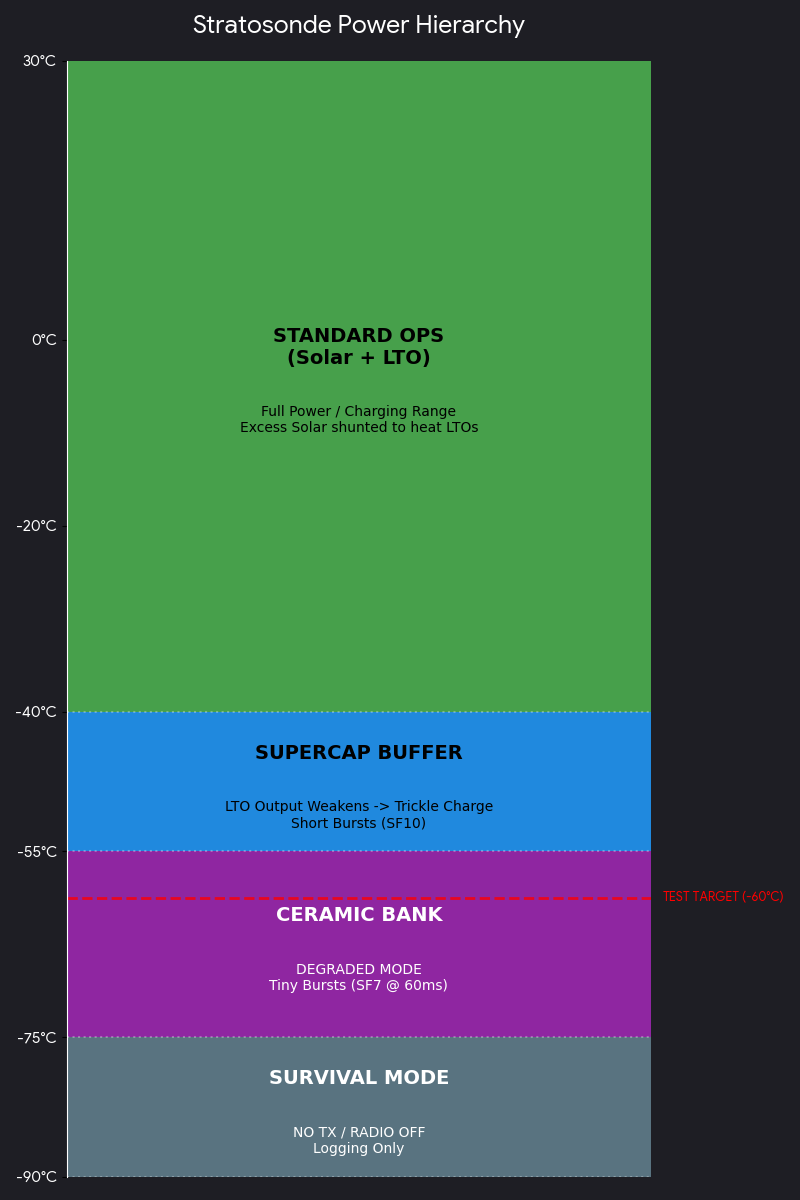
This cascading architecture creates a graceful degradation path:
- Normal mode (+25°C to -40°C): Solar → LTO → Buck converter → 3.3V rail
- Degraded mode 1 (-40°C to -60°C): Solar → LTO → Supercap → Buck converter
- Degraded mode 2 (Below -60°C): LTO → Supercap → Ceramics → Buck converter for brief transmissions
- Survival mode (Extreme conditions): GPS and sensor logging only, no RF transmission, data stored for later upload
Supercapacitor + 2S LTO Characterization: Testing the Second Layer
To validate the degraded mode architecture, the second power layer (supercapacitor + 2S LTO) was tested across the stratospheric temperature range.
Test Configuration
Supercapacitor:
- Type: 5.5V rated electrochemical double-layer capacitor (EDLC)
- Capacitance: 1.5F (1,500,000 μF)
- ESR: <100 mΩ at room temperature (manufacturer spec)
- Initial charge: 5.5V from 2S LTO cells at room temperature
2S LTO Battery Pack:
- Configuration: Two HTC1015 cells in series (2S1P)
- Nominal voltage: 4.8V (2.4V per cell)
- Capacity: 40 mAh per cell
- Initial state: ~70% state of charge
Test Method:
- Thermal chamber with controlled temperature profile
- Load testing at each temperature point:
- No-load voltage measurement (Vmax)
- 100mA load for 400ms (radio transmission simulation)
- 50mA load if 100mA causes voltage collapse
- Further reduced loads at extreme temperatures
- Soak time: 2 hours at each temperature for thermal equilibrium
Results: The Supercapacitor Catastrophic Cliff
The test data reveals a supercapacitor performance profile remarkably similar to the LTO cells—excellent performance across a wide range, then catastrophic failure below a critical temperature:
Supercapacitor + 2S LTO Temperature Response:
| Temp (°C) | Vmax No-Load | Vmin @ 100mA | Vmin @ 50mA | Load (mA) | Notes |
|---|---|---|---|---|---|
| +20 | 5.15 V | 5.08 V | — | 100 | Baseline: 70mV droop |
| 0 | 5.15 V | 5.08 V | — | 100 | Identical to room temp |
| -10 | 5.15 V | 5.07 V | — | 100 | 80mV droop, still excellent |
| -20 | 5.14 V | 5.05 V | — | 100 | 90mV droop |
| -30 | 5.11 V | 5.04 V | — | 100 | 70mV droop, voltage starting to sag |
| -40 | 5.14 V | 5.03 V | — | 100 | 110mV droop, LTO contribution degrading |
| -45 | 5.13 V | 5.02 V | — | 100 | 110mV droop |
| -50 | 5.09 V | 4.96 V | — | 100 | 130mV droop, both cap and LTO degrading |
| -55 | 5.05 V | 4.91 V | 4.70 V | 100/50 | 100mA: 140mV droop. 50mA test: 350mV droop |
| -60 | 4.90 V | 0.1 V | 2.63 V | 100/50 | Supercap failure at 100mA. 50mA: catastrophic 2.27V droop |
| -60 | 4.54 V | 0.5 V | 1.0 V | 25/20 | Alternate test: even 20-25mA causes multi-volt collapse |
Critical Observation at -60°C:
The supercapacitor experiences complete voltage collapse under 100mA load:
- No-load voltage: 4.90V
- Under 100mA load: 0.1V (voltage dropped by 4.8V!)
- Under 50mA load: 2.63V (still a 2.27V droop)
- Under 25mA load: 0.5V
- Under 20mA load: 1.0V
This isn’t gradual degradation—it’s catastrophic failure. At -60°C, the supercapacitor can barely sustain 20mA without collapsing below the buck converter minimum input voltage (~2.5V).
Calculated ESR vs Temperature
Using the two-point voltage measurement under different loads:
$ ESR = \frac{V_{noload} - V_{load}}{I_{load}} $
Supercapacitor Effective ESR:
| Temperature | No-Load V | Load Current | Load Voltage | ESR |
|---|---|---|---|---|
| +20°C | 5.15 V | 100 mA | 5.08 V | 0.70 Ω |
| -40°C | 5.14 V | 100 mA | 5.03 V | 1.10 Ω |
| -50°C | 5.09 V | 100 mA | 4.96 V | 1.30 Ω |
| -55°C | 5.05 V | 100 mA | 4.91 V | 1.40 Ω |
| -60°C | 4.90 V | 50 mA | 2.63 V | 45.4 Ω |
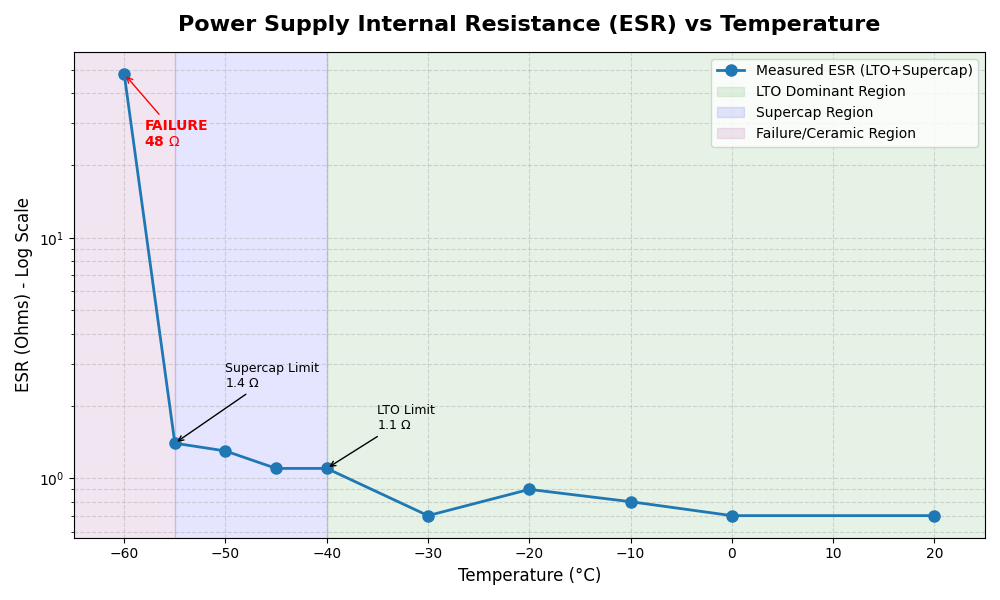
At -60°C, the supercapacitor ESR increases by 65× compared to room temperature. For context:
- Room temperature: 0.70 Ω (reasonable for an EDLC)
- -40°C: 1.10 Ω (1.6× increase, manageable)
- -60°C: 45.4 Ω (catastrophic)
The ESR increase is even more severe than the LTO cells (which showed 800× increase but from a lower baseline). At -60°C, the supercapacitor has essentially become a 45-ohm resistor with some stored charge.
Physical Mechanism:
Supercapacitors store energy electrostatically at the electrode/electrolyte interface, not through chemical reactions like batteries. But they still rely on ionic conductivity in the electrolyte:
$ ESR = R_{electrolyte} + R_{contact} + R_{separator} $
Below -50°C:
- Electrolyte viscosity increases exponentially
- Ionic mobility drops (ions become “frozen”)
- Double-layer capacitance decreases (ions can’t reach electrode surface)
- Leakage current increases (parasitic pathways dominate)
The result: what was a low-ESR energy buffer becomes a high-resistance component unable to deliver useful current.
Why the Cascade Works: Load Decoupling Analysis
The power cascade functions because each layer decouples the load from the source impedance of the layer above it:
Layer 1→2: LTO Battery to Supercapacitor
Without supercapacitor (direct battery to buck converter):
At -60°C, LTO has Rbatt ≈ 8Ω per cell = 16Ω for 2S.
During 100mA transmission burst: $ V_{buck_input} = V_{batt} - I_{load} \times R_{batt} $ $ V_{buck_input} = 4.0V - (0.1A \times 16Ω) = 4.0V - 1.6V = 2.4V $
Buck converter minimum input: ~2.5V. The system would brown out.
With supercapacitor buffer:
The battery trickle-charges the supercap over the 5-minute inter-transmission interval: $ I_{trickle} = \frac{V_{batt} - V_{cap}}{R_{batt}} $
At -60°C with Rbatt = 16Ω: $ I_{trickle} = \frac{4.0V - 3.8V}{16Ω} = 12.5 mA $
Energy accumulated over 300 seconds: $ E = \frac{1}{2}C(V_i^2 - V_f^2) $
But at this temperature, the supercapacitor itself has 45Ω ESR and cannot deliver the burst current. This is where layer 3 becomes critical.
Layer 2→3: Supercapacitor to Ceramic Capacitor Bank
The buck converter advantage:
Before analyzing the ceramic bank, it’s critical to understand how the buck converter fundamentally improves the system. The TI buck converter provides two key benefits:
-
Input current reduction: For 50mA @ 3.3V output (165mW), the buck requires only 194mW input (at 85% efficiency). At 5V input, this is just 38.8mA—a 22% reduction in current draw from the ceramic bank.
-
Voltage droop tolerance: The buck operates across a wide input range (5V down to ~2.5V minimum). This allows significant voltage droop before system failure. Even with 50Ω total ESR at extreme cold, the voltage droop is only 38.8mA × 50Ω = 1.94V, leaving final voltage at 3.06V—well above the 2.5V minimum.
This is crucial: the buck converter doesn’t just regulate voltage—it makes the ceramic bank viable by reducing current requirements and tolerating massive voltage sag.
The ceramic capacitor advantage:
Ceramic (Class I: C0G/NP0) capacitors maintain stable capacitance across temperature:
- Typical temperature coefficient: ±30 ppm/°C
- At -60°C: capacitance change <0.3%
- ESR remains low: <50 mΩ for appropriate packages
Why ceramics work when supercaps fail:
Ceramic capacitors use a solid dielectric (barium titanate, titanium dioxide), not a liquid electrolyte. There’s no ion mobility issue—the energy storage is pure electrostatic field in a solid material.
Ceramic Bank Sizing:
At extreme cold, the goal is minimum viable transmission—any packet that might be received. The optimized degraded mode:
- Transmission: SF7, 60ms @ 50mA (output)
- Output energy: 50mA × 3.3V × 0.060s = 9.9mJ
- Input energy (with 85% buck efficiency): 9.9mJ / 0.85 = 11.6mJ
The ceramic bank operates at the 2S LTO voltage (~5V when charged), not the 3.3V rail:
Operating voltage range:
- Charged: 5V (from LTO/supercap)
- Minimum: 2.5V (buck converter minimum input)
- Usable voltage swing: 5V → 2.5V
Available energy per 220μF capacitor: $ E = \frac{1}{2}C(V_{high}^2 - V_{low}^2) = \frac{1}{2}(220 \times 10^{-6})(5^2 - 2.5^2) = 2.06 mJ $
Required capacitance: $ C_{total} = \frac{2 \times E_{input}}{V_{high}^2 - V_{low}^2} = \frac{2 \times 0.0116}{25 - 6.25} = 1.24 mF $
Final design:
- Capacitors: 6× 220μF ceramic (C0G/NP0), 6.3V rated
- Total capacitance: 1.32 mF
- Stored energy: 12.4 mJ
- Margin: 1.07× over requirement
- Mass: ~6g (vs 27.5g in initial analysis)
This is the optimized trade-off: Using 5V operation and reduced transmission requirements, the ceramic bank drops from 55 capacitors (27.5g) to just 6 capacitors (6g)—a 78% reduction. The revised mass budget:
- LTO cells: 2.4g × 2 = 4.8g
- Supercapacitor: ~3g
- Ceramic bank: 6g
- Total energy storage mass: 13.8g
For a balloon payload where the entire electronics might be 150g, 13.8g for power is extremely reasonable—enabling emergency transmissions at -60°C while maintaining acceptable mass fraction.
Operational Strategy: Mode Switching Logic
The microcontroller continuously monitors battery voltage and temperature to select the appropriate power mode:
Mode 1: Normal Operation (Above -40°C)
Power Flow:
Solar → BQ25570 → 2S LTO → Buck Converter → 3.3V Rail
                      ↓
                 Supercap (standby charging)
Transmission Strategy:
- Direct from LTO through buck converter
- Supercap float-charged to 5.5V as backup
- Full power transmission: SF7, 400ms, all payload fields
- Transmission interval: 5 minutes
Energy Balance:
- Solar input (average): 50-100mW daytime
- Battery can deliver 20-100mA easily
- Supercap provides <1% of transmission energy (buffer only)
Mode 2: Supercap-Buffered Operation (-40°C to -55°C)
Power Flow:
Solar → BQ25570 → 2S LTO (trickle) → Supercap → Buck Converter → 3.3V Rail
                      ↓ (slow charge)      ↓ (burst discharge)
Transmission Strategy:
- LTO charges supercap over 5-minute interval
- Supercap delivers burst current for transmission
- LTO internal resistance too high for direct load
- Degraded transmission: SF7, reduced payload
- Transmission interval: 5-10 minutes (depends on charging rate)
Energy Balance:
- LTO trickle current: 5-15mA
- Supercap charges to 4.5-5.0V
- Each transmission drains supercap by ~0.2V
- Recovery time: 2-5 minutes
Mode 3: Ceramic Bank Operation (Below -55°C)
Power Flow:
Solar → BQ25570 → 2S LTO → Supercap → Ceramic Bank → Buck Converter → 3.3V Rail
         (day only)   ↓          ↓              ↓
                   (trickle)  (slow)         (burst)
Transmission Strategy:
- Supercap trickle-charges ceramic bank
- Ceramic bank delivers ultra-brief pulse
- Minimum packet: position + battery voltage only
- Transmission interval: 10-30 minutes (depends on ceramic charging time)
Transmission Power Budget:
A minimal LoRaWAN packet at SF7 with reduced power:
- Output: 50mA @ 3.3V for 60ms = 9.9mJ
- Buck input (85% efficiency): 9.9mJ / 0.85 = 11.6mJ
- Buck input current: 11.6mJ / (60ms × 5V) = 38.8mA
The ceramic bank (6× 220μF = 1.32mF @ 5V) stores: $ E = \frac{1}{2}C(V_{high}^2 - V_{low}^2) = \frac{1}{2}(0.00132)(5^2 - 2.5^2) = 12.4 mJ $
Margin: 12.4mJ / 11.6mJ = 1.07× (acceptable for minimum viable operation)
The reduced transmission power (50mA vs 100mA) slightly decreases range but is compensated by line-of-sight communication from altitude. More importantly, it enables a 78% reduction in ceramic capacitor mass—from 27.5g to just 6g.
Mode 4: Data Logging Only (Extreme Survival)
If voltage drops below minimum for even ceramic-buffered transmission:
Power Flow:
Solar → BQ25570 → 2S LTO → Buck Converter → 3.3V Rail (sensors only)
Operational Strategy:
- GPS position fix: every 10-30 minutes
- Environmental sensors: pressure, temperature, humidity
- Data logged to flash memory (non-volatile)
- No RF transmission (radio powered down)
- Extremely low average power: <5mW
Data Storage:
STM32 flash: 256KB available for logging
- Each log entry: 32 bytes (timestamp, GPS coordinates, sensors, battery voltage)
- Storage capacity: 8,000 entries
- At 10-minute interval: 55+ days of logged data
Recovery Strategy:
When conditions improve (battery warms, solar power increases):
- System detects voltage above ceramic-buffered threshold
- Switches to Mode 3
- Uploads backlog of stored telemetry in batches
- Resume periodic transmissions
This ensures mission data is preserved even during multi-hour periods of extreme cold or nighttime darkness.
Thermal Management: The Zener Heating Strategy
The cascade architecture includes active thermal management to prevent batteries from reaching catastrophic temperature regimes:
Excess Solar Power Dissipation
The BQ25570 solar harvester has a maximum power point tracking (MPPT) feature that optimizes solar panel voltage for maximum power extraction. But once the battery reaches maximum voltage (5.6V for 2S LTO), additional solar power becomes waste.
Conventional approach: Solar panel voltage rises, power extraction drops, excess energy unused.
Stratosonde approach: Shunt excess power to Zener diodes thermally coupled to LTO cells.
Zener Diode Heat Dissipation:
Zener voltage selected slightly above battery maximum:
- Battery max: 5.6V (2.8V per cell)
- Zener voltage: 5.8V
- When battery full, Zener conducts excess current
Power dissipation: $ P_{zener} = V_Z \times I_{shunt} $
At peak solar (100mW), if battery is full: $ I_{shunt} = \frac{P_{solar}}{V_Z} = \frac{0.1W}{5.8V} = 17.2 mA $ $ P_{heat} = 5.8V \times 0.0172A = 100mW $
All solar power converted to heat!
Thermal Coupling:
Zener diodes mounted on small PCB thermally bonded to LTO cell bodies:
- Thermal interface material (TIM): silicone thermal pad
- Thermal resistance: ~5 °C/W (estimate for small package)
- Temperature rise: ΔT = P × R = 0.1W × 5°C/W = 0.5°C
Disappointingly small… until you consider this is continuous heating during peak sun.
Combined Thermal Management
Heat Sources:
- Zener dissipation: up to 100mW during bright sun
- Buck converter inefficiency: ~5-10mW continuous
- LTO internal resistance losses: ~2-5mW
- Radio PA dissipation: ~50mW during transmission (400ms every 5 min = 1.3mW average)
Total heating power: ~10-120mW depending on conditions
Thermal Enclosure:
Batteries enclosed in mylar envelope:
- Exterior: black (solar absorption)
- Interior: reflective (IR barrier)
- Thermal resistance to ambient (estimate): 20-40 °C/W
Temperature rise above ambient: $ \Delta T = P \times R_{thermal} $
Best case (100mW heating, 40°C/W): $ \Delta T = 0.1W \times 40°C/W = 4°C $
Modest, but significant. At -60°C ambient: $ T_{battery} = -60°C + 4°C = -56°C $
This moves the battery from “catastrophic regime” to “barely functional regime”—still using ceramic buffering, but perhaps with slightly better supercap performance.
The Critical Point:
Thermal management alone cannot solve the cold problem. It can shift operating temperature by a few degrees, but the fundamental physics remains. The cascade architecture assumes batteries will operate at near-ambient temperatures and compensates with lower layers.
Why Not Just Use the Worst Case (Ceramic Only)?
An obvious question: if ceramic capacitors work across the full temperature range, why not eliminate batteries and supercaps entirely?
The Solar-Direct Problem:
Ceramic capacitors store energy for milliseconds to seconds. Solar panels produce power for hours but with:
- Variable illumination (balloon rotation, cloud cover, sun angle)
- Zero nighttime power
- Instantaneous power < average transmission power
Energy Balance:
Radio transmission: ~130mJ per 5-minute interval = 0.43mW average Solar panel at moderate angle: 20-100mW
The solar panel produces 50-200× more power than needed… during the day. At night: zero.
Without batteries, you’d need:
- Enormous ceramic bank to store nighttime energy (hours of operation)
- Nighttime duration: ~12 hours
- Average power: 5mW (MCU sleep + GPS fixes)
- Energy needed: 5mW × 12hr × 3600s/hr = 216 kJ
- Ceramic storage @ 3.3V: E = ½CV²
- Required capacitance: C = 2E/V² = 2(216kJ)/(3.3V)² = 39,700 Farads
Each 100μF ceramic: 0.0001F → need 397 million capacitors. Obviously impossible.
- Accept nighttime shutdown (solar-only operation)
- Transmit only during daylight
- No nighttime telemetry
- Unacceptable for trajectory prediction and safety
The LTO + Supercap + Ceramic Strategy:
Instead:
- LTO provides multi-hour to multi-day energy storage (40mAh = 345J)
- Supercap decouples high current from battery resistance (-40°C to -60°C)
- Ceramics provide ultra-reliable low-temp operation (below -60°C)
- Solar recharges batteries during day
This achieves 24/7 operation across full temperature range with reasonable mass budget.
Cold Chamber Validation: Next Steps
The supercap + 2S LTO characterization confirms the cascade architecture concept, but system-level validation remains:
Planned Testing:
- Full System Cold Chamber Test
- Complete Stratosonde electronics
- Solar simulator (adjustable illumination)
- Temperature profile: +25°C → -60°C in 10°C steps
- Duration: 72+ hours per temperature point
- Metrics: battery voltage, supercap voltage, ceramic bank voltage, transmission success rate
- Cascade Mode Transition Verification
- Verify automatic switching between power modes
- Measure transition thresholds (when does supercap takeover occur?)
- Confirm ceramic bank charging at extreme cold
- Zener Heating Effectiveness
- Measure actual temperature rise with different solar inputs
- Thermal imaging to verify heat transfer to LTO cells
- Determine thermal time constant (how long to warm batter by 5°C?)
- Long-Duration Night Simulation
- 24-hour darkness simulation at -60°C
- Measure battery depletion rate
- Verify supercap can sustain periodic transmissions
- Test ceramic bank degraded-mode operation
- Thermal Cycling
- Repeated +25°C → -60°C → +25°C cycles
- Detect any degradation over 10+ cycles
- Verify no damage from thermal stress
- Flight Heritage Test
- Actual balloon flight to 20km
- Real-world solar illumination at altitude
- True stratospheric temperature exposure
- Validate cascade mode switching in operational environment
Each test builds confidence in the cascade architecture before committing to a multi-day stratospheric mission.
Comparison: Conventional vs Cascading Architecture
To illustrate the advantage of the cascade strategy, consider conventional architectures:
Architecture A: Battery Only (Simple Approach)
Configuration:
- 2S LTO battery
- Buck converter to 3.3V
- Direct load connection
Performance:
- +25°C to -30°C: Excellent (low R_batt)
- -30°C to -40°C: Degraded (high R_batt causes voltage sag)
- Below -40°C: Mission failure (voltage collapse)
Failure Mode: Hard cutoff at -40°C
Architecture B: Supercap Only (No Chemical Storage)
Configuration:
- Solar panels
- Large supercapacitor (1-5F)
- Buck converter
Performance:
- Daytime: Works if supercap can store enough energy
- Nighttime: Mission failure (no energy storage)
- Below -60°C: Mission failure (supercap ESR too high)
Failure Mode: Cannot operate at night, fails below -60°C
Architecture C: Cascading (Stratosonde Approach)
Configuration:
- Solar → 2S LTO → Supercap → Ceramic bank → Buck converter
- Mode switching based on temperature/voltage
Performance:
- +25°C to -40°C: Excellent (battery-direct mode)
- -40°C to -60°C: Degraded (supercap-buffered mode)
- Below -60°C: Minimal (ceramic-buffered mode)
- Below -65°C: Survival (data logging only)
Failure Mode: Graceful degradation, never hard cutoff
The cascade architecture trades complexity for resilience. Each additional layer adds:
- More components (failure points)
- More mass (~10g additional beyond basic battery)
- More firmware logic (mode switching)
But gains:
- 20°C+ additional operating range
- Graceful degradation instead of hard failure
- Operation across day/night cycles through mode switching
- Thermal margin during worst-case conditions
For a stratospheric balloon where recovery is impossible and mission success depends on continuous telemetry, the trade is worth it.
Design Equations: Sizing the Cascade
For engineers implementing similar architectures, the key design equations:
Solar Panel Power
Minimum solar power for positive energy balance: $ P_{solar,min} = \frac{P_{system,avg}}{\eta_{harvest} \times f_{sun}} $
Where:
- P_system,avg: average system power
- η_harvest: harvesting efficiency (BQ25570)
- f_sun: fraction of time in sunlight
For Stratosonde (5mW average, 70% harvest efficiency, 50% sun time): $ P_{solar,min} = \frac{0.005W}{0.70 \times 0.50} = 14.3 mW $
Use 100mW solar cells (7× margin for temperature derating, angle losses)
LTO Battery Capacity
Required capacity for N hours of nighttime operation: $ Q_{LTO} = \frac{P_{avg} \times t_{night}}{\eta_{buck} \times V_{batt,nom}} $
Where:
- P_avg: average system load (W)
- t_night: nighttime duration (s)
- η_buck: buck converter efficiency
- V_batt,nom: nominal battery voltage
For Stratosonde (12hr night, 5mW average, 85% efficient buck, 4.4V battery): $ Q_{LTO} = \frac{0.005W \times 43200s}{0.85 \times 4.4V} = 57.8 mAh $
Use 2× 40mAh cells = 80mAh total (1.4× margin)
Supercapacitor Sizing
Required capacitance for M transmissions without battery charging: $ C_{super} = \frac{2 \times E_{tx} \times M}{V_{max}^2 - V_{min}^2} $
Where:
- E_tx: energy per transmission (J)
- M: number of transmissions
- V_max, V_min: voltage range
For Stratosonde (130mJ per tx, 50 transmissions, 5.5V max, 4.0V min): $ C_{super} = \frac{2 \times 0.13J \times 50}{(5.5)^2 - (4.0)^2} = \frac{13}{30.25 - 16} = 0.91F $
Use 1.5F capacitor (1.6× margin)
Ceramic Capacitor Bank
Required capacitance for minimal transmission with buck converter: $ C_{ceramic} = \frac{2 \times E_{output} / \eta_{buck}}{V_{max}^2 - V_{min}^2} $
Where:
- E_output: radio output energy requirement (J)
- η_buck: buck converter efficiency (~0.85)
- V_max: charged voltage from LTO/supercap (5V)
- V_min: buck minimum input voltage (2.5V)
For Stratosonde (9.9mJ output @ 50mA, 60ms SF7 packet): $ C_{ceramic} = \frac{2 \times 0.0099 / 0.85}{5^2 - 2.5^2} = \frac{0.0233}{18.75} = 1.24 mF $
Use 6× 220μF ceramic capacitors (1.32mF total, 1.07× margin)
Conclusion: Cascading Power as a Design Philosophy
The Stratosonde cascading power architecture demonstrates a fundamental principle in extreme-environment engineering: when individual components fail at different points across the operating envelope, intelligent layering can extend system capability far beyond any single component’s limits.
This isn’t about redundancy—having two batteries in case one fails. It’s about deliberately designing a multi-layer system where each layer assumes the previous layer’s degradation.
What the characterization proved:
-
Supercapacitors fail catastrophically below -60°C, with ESR increasing 65× and voltage collapse under even modest loads. The test data shows 100mA loads causing 4.8V voltage drops—complete failure.
-
The cascade strategy works: By progressively handing off to lower layers (LTO → Supercap → Ceramics), the system maintains some level of functionality across a 85°C temperature range (+25°C to -60°C).
-
Graceful degradation is achievable: Instead of hard failure at -40°C (battery-only) or -60°C (supercap-only), the system degrades through defined modes: normal → buffered → minimal → logging-only.
-
Mass penalty is acceptable: The full cascade (LTO + supercap + ceramic bank + solar) totals ~15g for the complete power system (13.8g energy storage + ~1-2g solar cells). For a stratospheric balloon where this enables continuous multi-day operation across extreme temperatures, the trade is justified.
What remains unknowable without flight test:
The characterization was performed in a thermal chamber—a controlled environment that cannot perfectly replicate stratospheric conditions:
- 1% atmospheric pressure (affects convective cooling, outgassing)
- Direct solar illumination at altitude (more intense than sea-level sun)
- Radiation environment (minimal but present)
- Dynamic thermal cycling (day/night, balloon rotation, altitude changes)
- Multi-day exposure (cumulative degradation effects)
The cascade architecture provides margin for unknowns. If supercap performance is worse than characterized, the ceramic layer activates earlier. If thermal management works better than predicted, the system operates in higher-performance modes longer.
Design for the worst case, operate in the best case, degrade gracefully through the middle cases.
For space-constrained applications where failure means mission loss, this philosophy transforms power system design from “selecting the right battery” to “architecting a system that never completely fails.”
The physics of electrochemistry at -60°C is unforgiving. But with enough engineering layers between the physics and the mission requirements, even frozen batteries can power a radio at the edge of space.
Test data: lto_supercap_test_data.csv