Thin-Film Resistor Swap Cuts AD7746 Drift 5× — Prediction Confirmed
Thin-Film Resistor Swap Cuts AD7746 Drift 5× — Prediction Confirmed
The Prediction
In the previous post, we decomposed the AD7746 measurement chain’s temperature drift using open-circuit and loaded plunge tests from +22°C to −80°C. The signed analysis showed:
- Total system drift: −84.6 ppm/°C (cap reads higher as board cools)
- ADC + electronics: +10.1 ppm/°C (opposite direction — partially masking the problem)
- Non-electronic drift: −94.7 ppm/°C
- Resistor divider contribution: at least −65 ppm/°C
The thick-film resistors (±100 ppm/°C) in the AN-1585 range extender were overwhelmingly the dominant error source. The fix: swap them for precision thin-film parts.
The Fix
We replaced the range extender resistors:
| Before | After | |
|---|---|---|
| R1 | 100 kΩ thick-film (±100 ppm/°C) | 100 kΩ thin-film (±5 ppm/°C) |
| R2 | 118 kΩ thick-film (±100 ppm/°C) | 120 kΩ thin-film (±5 ppm/°C) |
| F factor | 12.11 | 11.00 |
| Cost per resistor | $0.01 | $2.00 |
The 118 kΩ → 120 kΩ change was deliberate — 118 kΩ is only available in thick film at 0402. Switching to the standard E24 value of 120 kΩ opens up precision thin-film options. The F factor drops slightly (12.11 → 11.00), reducing the effective measurement range from ±48.5 pF to ±44 pF — still more than enough for the P14 Rapid’s ±8 pF humidity swing.
The Test
Same protocol as before: 140 pF C0G reference capacitor through the range extender, Stirling cooler plunge from +22°C to −78°C. This time 12.2 hours, 8,755 samples.
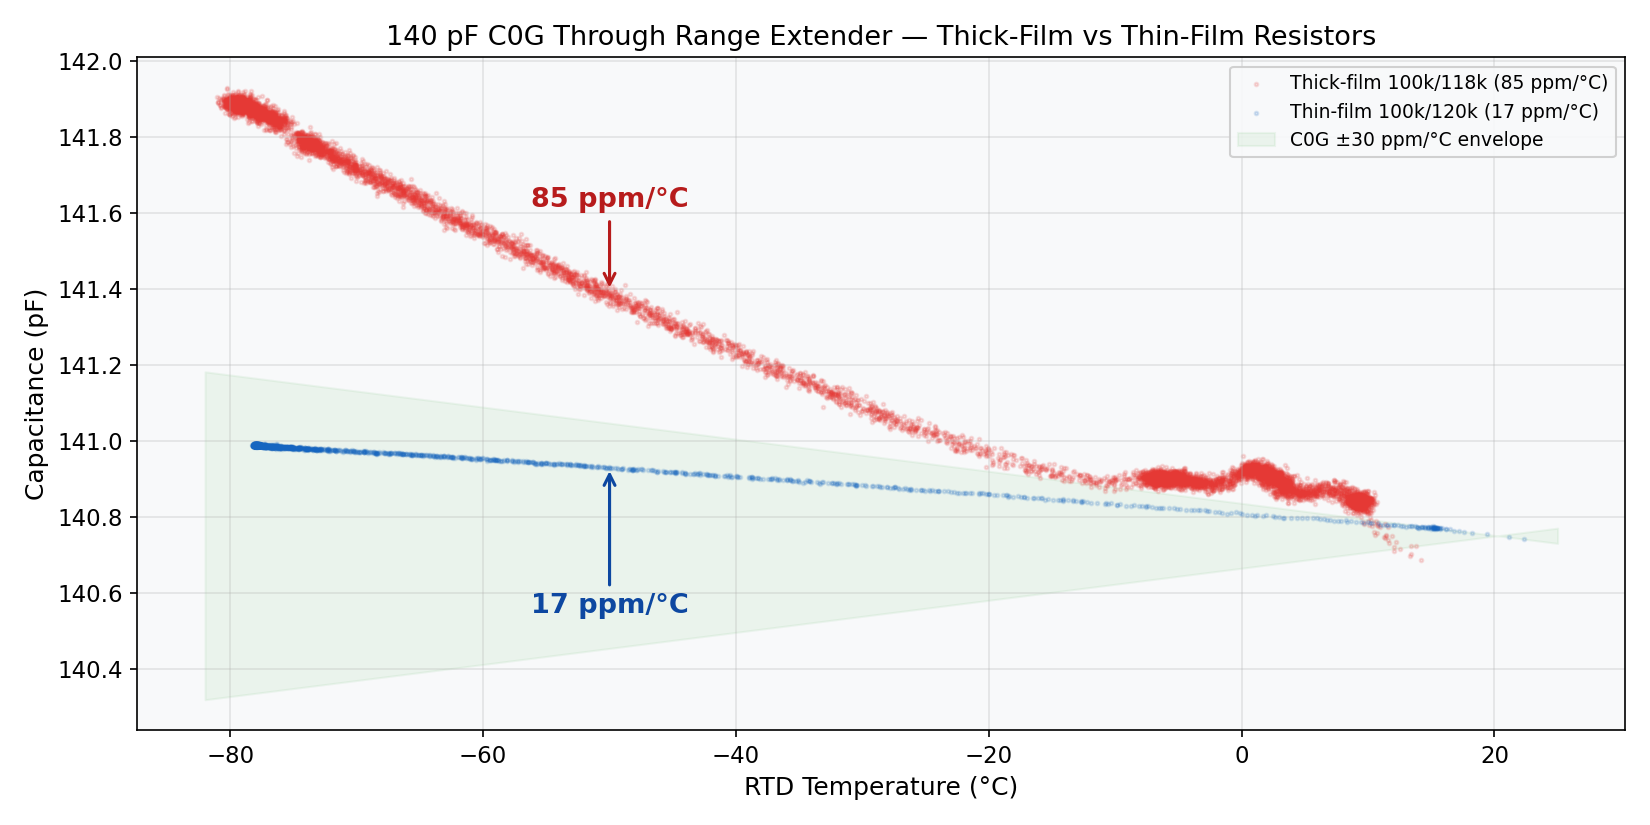
The red cloud is the old thick-film data. The blue cloud is the new thin-film data. The green band is the C0G ceramic’s ±30 ppm/°C spec envelope. The thin-film data sits inside the C0G envelope.
The Numbers
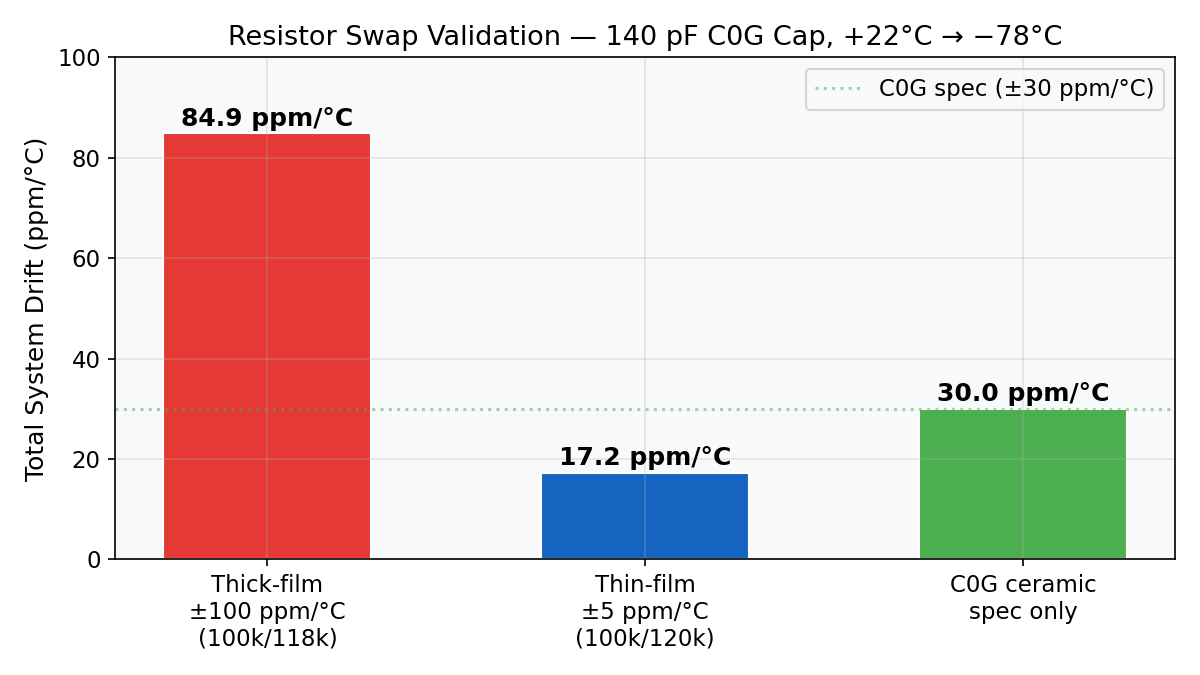
| Metric | Thick-film | Thin-film | Improvement |
|---|---|---|---|
| Total drift | 84.9 ppm/°C | 17.2 ppm/°C | 4.9× |
| fF per °C | 11.95 fF/°C | 2.43 fF/°C | |
| Excess over C0G spec | +54.9 ppm/°C | −12.8 ppm/°C | |
| ΔC over full sweep | 1,065 fF | 238 fF |
The thin-film system drifts less than the C0G ceramic spec alone (17.2 vs 30 ppm/°C). This makes sense: the ADC’s opposing +10.1 ppm/°C drift partially cancels the ceramic’s contribution, and the thin-film resistors add nearly nothing.
Prediction vs Reality
The previous post estimated the resistor divider contributed at least −65 ppm/°C. The actual reduction from the resistor swap: 84.9 − 17.2 = 67.7 ppm/°C — within 4% of the prediction. The signed decomposition model was correct.
| Predicted | Measured |
|---|---|
| Resistor contribution ≥65 ppm/°C | Resistor swap removed 67.7 ppm/°C |
| Thin-film drift ≈ C0G + ADC | Total 17.2 ppm/°C (C0G ±30 + ADC +10.1) |
What This Means for Flight
Over the actual flight temperature envelope (+25°C ground to −70°C in-flight, ΔT = 95°C), using the P14 Rapid sensor sensitivity of ~0.25 pF/%RH:
| Scenario | Drift (ppm/°C) | ΔC over flight | Uncalibratable ΔRH |
|---|---|---|---|
| Old (thick-film) | 84.9 | 1.13 pF | ±4.5 %RH |
| New (thin-film) | 17.2 | 0.23 pF | ±0.9 %RH |
The uncalibratable error dropped from ±4.5 %RH to ±0.9 %RH — well below the sensor’s own ±2 %RH accuracy spec. The system is ready for calibration.
RTD Reference Resistor: Uncertainty vs Accuracy
The range extender resistors affect the capacitance channel. But why does temperature accuracy matter for a humidity sensor? Because the ultimate goal is a calibrated humidity measurement with a traceable uncertainty budget. Every calibration point maps a (temperature, capacitance) pair to a %RH value. If the temperature reading carries a hidden systematic error, that error propagates directly into the humidity calibration — and unlike random noise, it cannot be averaged away.
The AD7746’s VT channel measures the Pt1000 RTD (IST AG P1K0.232.6W.A.010, Class A) through a 10 kΩ reference resistor. We swapped that reference from 25 ppm/°C to 5 ppm/°C and ran a second plunge to compare.
The noise looks identical
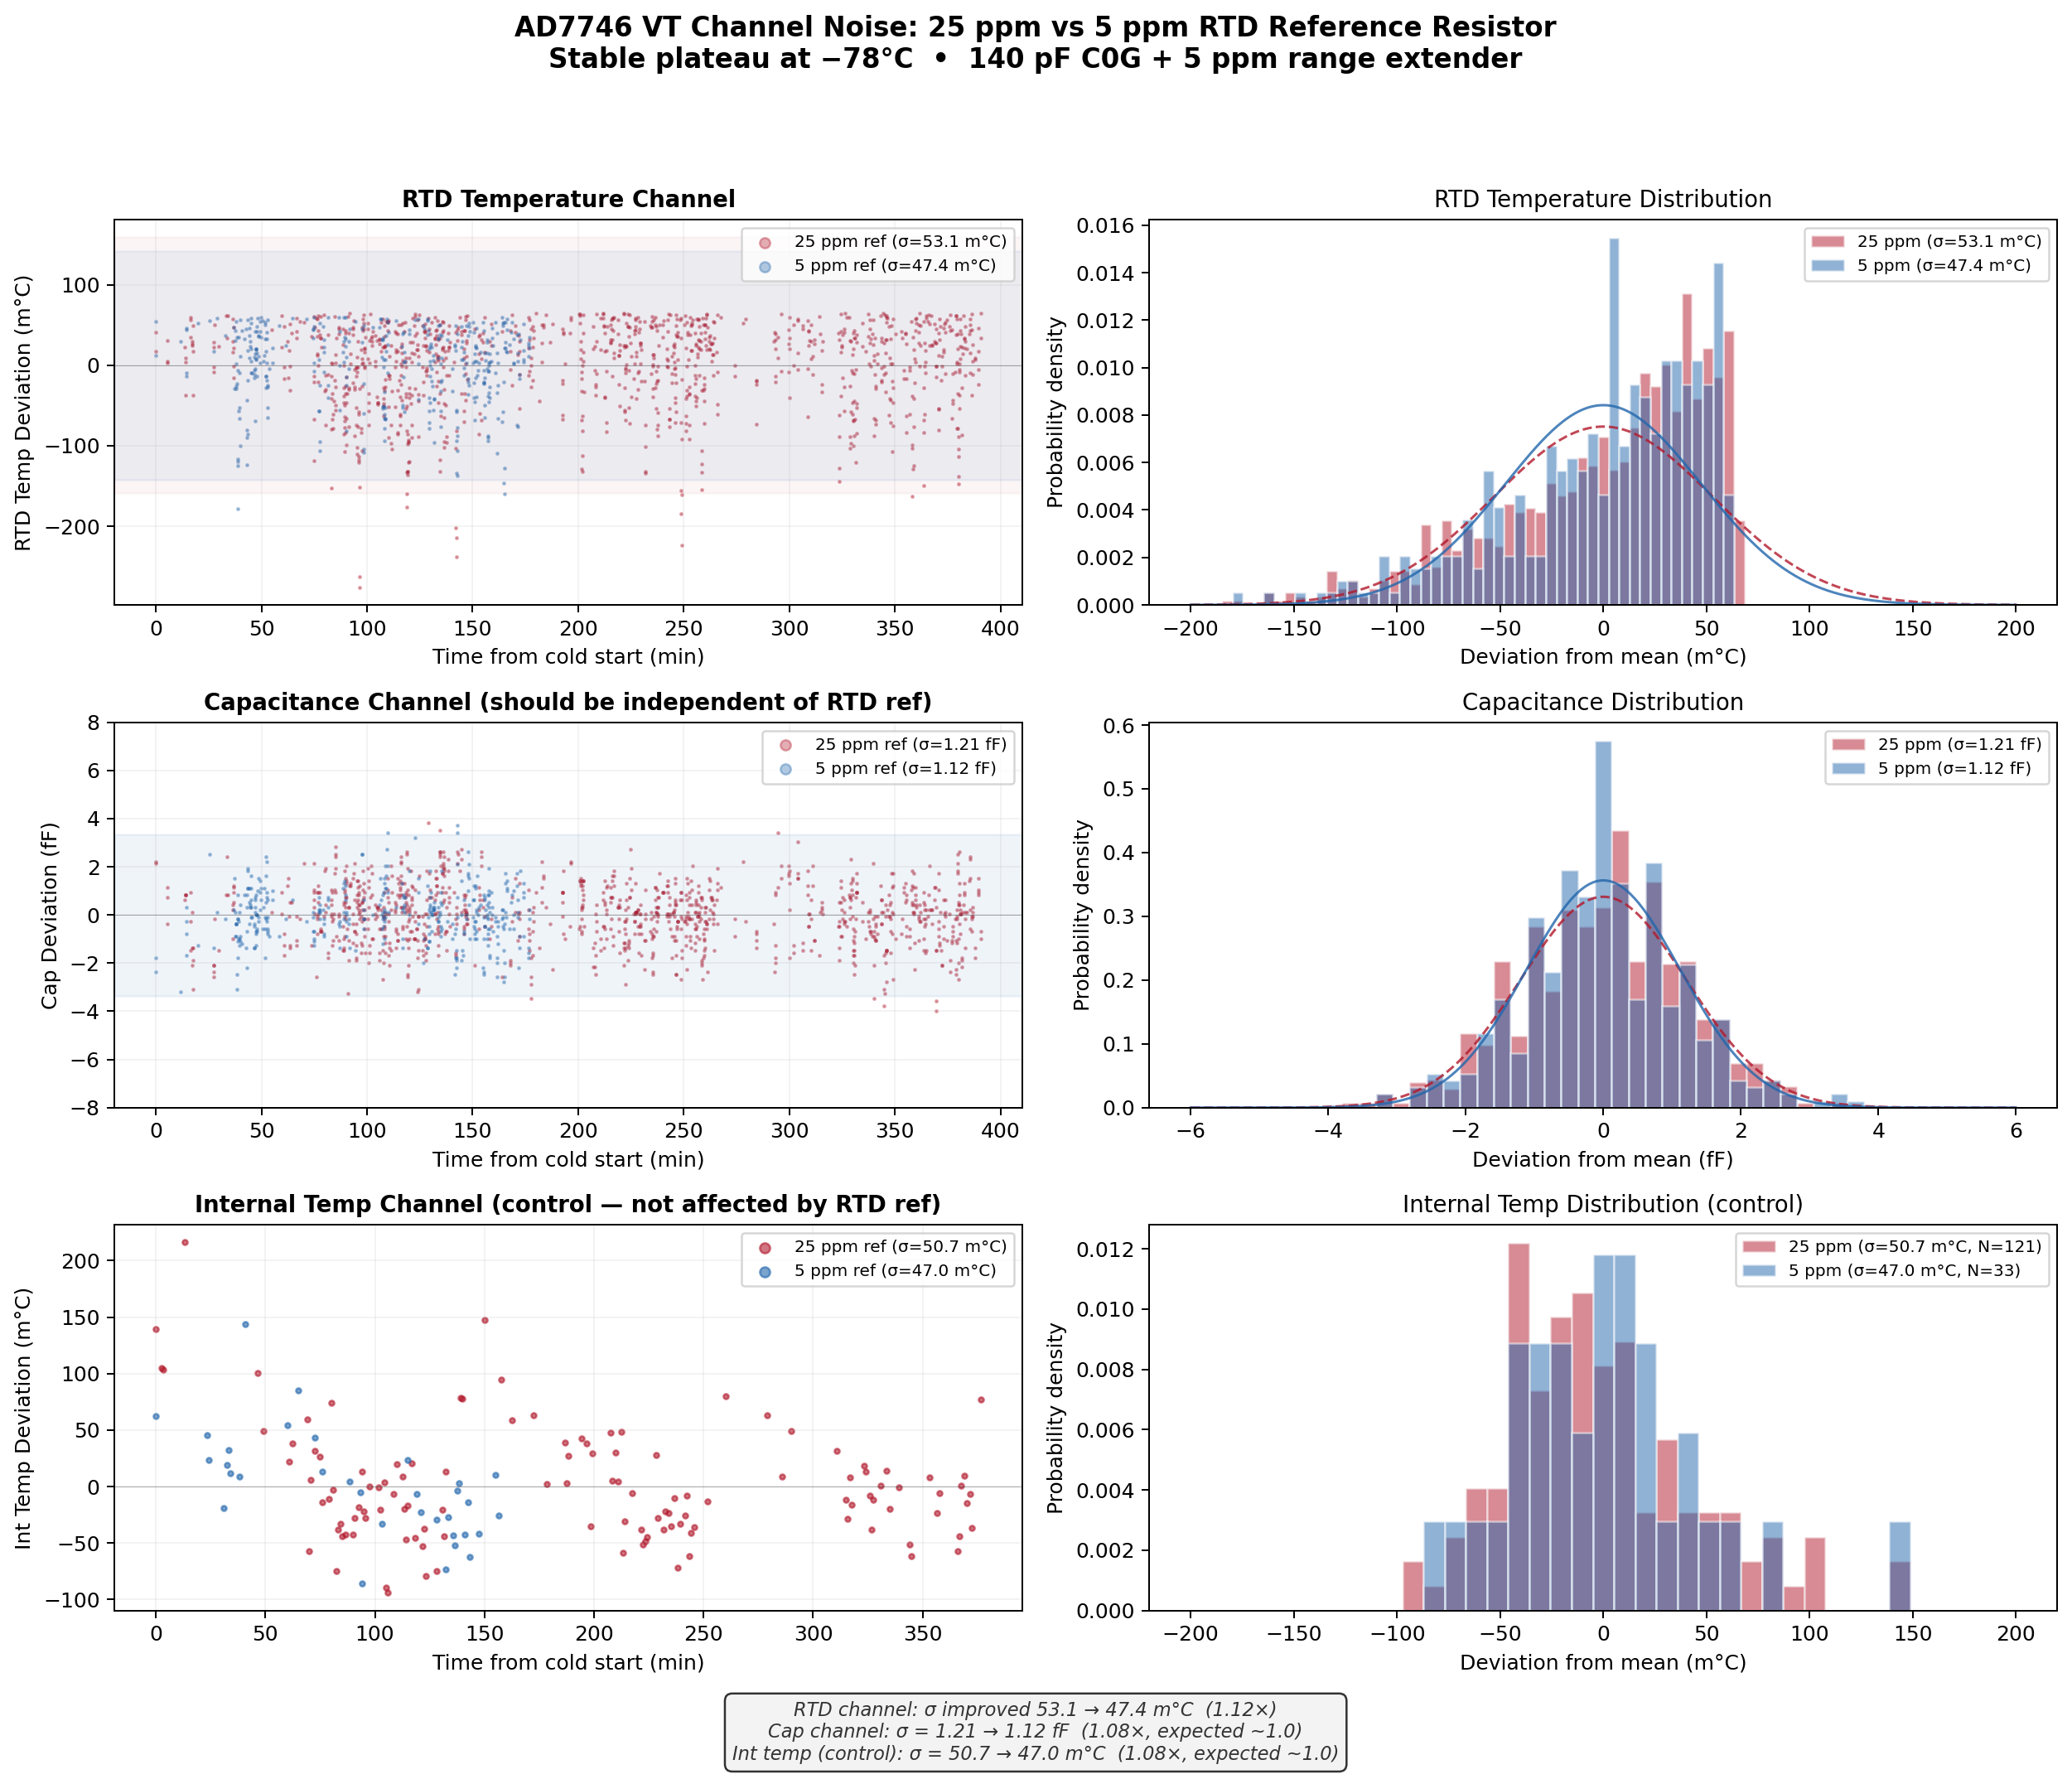
At the stable −78°C plateau, both reference resistors produce the same noise floor: σ ≈ 47 m°C in the RTD channel, σ ≈ 1.2 fF in the cap channel. The internal temperature sensor (which doesn’t use the external reference) confirms the test conditions were equivalent. The noise is ADC-limited, not reference-limited.
The accuracy is not
Noise is what you see in a histogram — random scatter around the mean. Accuracy is the systematic offset that accumulates across the temperature sweep. A reference resistor with 25 ppm/°C tempco doesn’t add noise; it quietly shifts the measurement baseline as the board cools.
The AD7746’s VT channel measures the ratio R_RTD / R_ref. As R_ref drifts with temperature, the measured ratio shifts, producing a systematic temperature error proportional to ΔT:
| Reference | Systematic error at −78°C | % of Pt1000 Class A budget | Error at −70°C (flight) |
|---|---|---|---|
| 25 ppm/°C | +425 m°C | 139% (exceeds spec) | +409 m°C (141%) |
| 5 ppm/°C | +85 m°C | 28% | +82 m°C (28%) |
With the 25 ppm reference, the reference resistor alone consumed 139% of the Pt1000 Class A tolerance budget (±0.306°C at −78°C). The reference was the accuracy-limiting component — not the sensor, not the ADC. The 425 m°C systematic drift would corrupt every temperature-dependent calibration point.
With the 5 ppm reference, the drift drops to 85 m°C — only 28% of the budget, leaving margin for the sensor’s own tolerance, self-heating, and lead resistance. The Pt1000 itself is now the limiting factor, as it should be.
What this means for the calibration report
In a formal uncertainty budget, noise and systematic error enter differently:
- Noise (σ ≈ 47 m°C) is a Type A uncertainty — measurable by statistics, reducible by averaging. It contributes to precision (repeatability).
- Reference drift (+425 or +85 m°C) is a Type B uncertainty — estimated from component specs, not reducible by averaging. It contributes to accuracy (trueness).
With the 25 ppm reference, the calibration report would need to declare a temperature uncertainty of at least ±0.43°C from the reference alone — larger than the Pt1000 sensor’s own ±0.31°C tolerance at −78°C. The reference resistor would dominate the uncertainty budget and limit the traceable accuracy of every humidity calibration point.
With the 5 ppm reference, the reference contribution drops to ±0.085°C, leaving the Pt1000 Class A tolerance (±0.31°C) as the dominant temperature uncertainty term. The combined temperature uncertainty is now set by the sensor, not the electronics — which is where it should be.
This error is invisible at a stable temperature plateau because it’s a fixed offset, not fluctuation. Two measurements at −78°C with different reference resistors will show the same noise but report slightly different absolute temperatures. You would only detect the 340 m°C difference by comparing both setups against a calibrated reference thermometer.
Lessons Learned
-
$4 worth of resistors was the entire problem. Two $2 thin-film resistors replaced $0.02 of thick-film parts and eliminated 80% of the system drift.
-
Signed decomposition caught what unsigned analysis missed. The original unsigned estimate suggested 44.5 ppm/°C from resistors. The signed analysis revealed the ADC was partially hiding the problem, predicting ≥65 ppm/°C — confirmed at 67.7 ppm/°C.
-
Characterize before calibrating. If we had proceeded directly to multi-point calibration with the thick-film resistors, every calibration point would have been contaminated by 84.9 ppm/°C of hardware drift that changes with temperature. The calibration would have been useless.
-
Identical noise doesn’t mean identical accuracy. The 25 ppm and 5 ppm RTD reference resistors produce indistinguishable noise at a stable temperature (both σ ≈ 47 m°C). But the 25 ppm reference was silently consuming 139% of the Pt1000 Class A tolerance budget with systematic drift — the kind of error that contaminates every calibration point but never shows up in a histogram or Allan deviation plot.
Next Steps
With the electronics drift now well below the sensor’s own temperature sensitivity, we can proceed to:
- Multi-point humidity calibration — salt-solution references (MgCl₂, NaCl, K₂SO₄) at multiple temperatures
- Flight-profile thermal cycling — verify the 17.2 ppm/°C holds over repeated cycles, not just a single plunge
- P14 Rapid sensor characterization — replace the C0G cap with the actual humidity sensor and measure against references