Seeing Stress: Birefringence Flaw Detection in Balloon Envelopes
Seeing Stress: Birefringence Flaw Detection in Balloon Envelopes
In the balloon inflation testing post, one of the clearest findings was that pinhole leaks are a real failure mode — the Silver 4-Gore 60″ balloon (entry 3 in the catalog) never reached burst pressure because pinholes developed first. Prestretching catches these leaks, but only after they’ve already formed. The question is: can flaws in the envelope material be detected before they become pinholes?
It turns out there’s a well-established optical technique for exactly this — birefringence imaging using cross-polarized light. It’s the same method used in materials science, mineralogy, and industrial quality control to visualize internal stress in transparent materials. And the setup costs about $30.
How Birefringence Works
Light is a transverse wave — it oscillates perpendicular to the direction it travels. Normally, light oscillates in all directions at once (unpolarized). A polarizer filter passes only the component oscillating in one specific direction, producing polarized light.
When polarized light enters a stressed transparent material like mylar, something interesting happens. The stress makes the material’s refractive index direction-dependent — light polarized along the stress direction travels at a different speed than light polarized perpendicular to it. This property is called birefringence.
The single polarized ray splits into two rays inside the material, each traveling at a slightly different speed. When they exit the material, they’re out of phase with each other. If you place a second polarizer (the “analyzer”) on the other side — oriented 90° to the first — normally no light would pass through (the two polarizers are “crossed” and block everything). But the birefringent material has rotated some of the light’s polarization, so some light does get through. How much light, and what color, depends on how much stress is in the material.
The result: stressed regions glow with interference colors against a dark background. Unstressed regions stay dark. Flaws, seams, wrinkles, and manufacturing defects — anything that creates localized stress — light up like a neon sign.
The Michel-Lévy Interference Colour Chart
The specific colors you see aren’t random. They follow a precise sequence described by the Michel-Lévy interference colour chart, first published in the 1880s for mineralogy.
The color depends on the retardation — the optical path difference (in nanometers) between the two split rays. Retardation is the product of three things: the material’s birefringence (how strongly stress-dependent its refractive index is), the thickness of the material, and the magnitude of the internal stress.
The colors progress through a repeating sequence of “orders”:
- First order (0–550 nm retardation): black → grey → white → yellow → orange → red
- Second order (550–1100 nm): violet → blue → green → yellow → red
- Third order (1100–1650 nm): violet → blue → green → yellow → pink
Each successive order repeats a similar rainbow but with increasingly washed-out, pastel colors. The transition from first-order red to second-order blue (around 550 nm) is particularly sharp and easy to spot.
For a uniform-thickness film like mylar, the retardation variation comes almost entirely from stress differences. So the color map directly reveals the stress field: higher-order colors mean more stress.
Here’s a piece of packing tape viewed through crossed polarizers — it shows most of the Michel-Lévy color spectrum because the adhesive layer creates varying amounts of stress during manufacturing:
 Packing tape under crossed polarizers. The rainbow of interference colors follows the Michel-Lévy chart sequence — each color corresponds to a specific amount of internal stress. This demonstrates the technique on a familiar material before applying it to balloon envelopes.
The Setup
The imaging setup is deliberately simple:
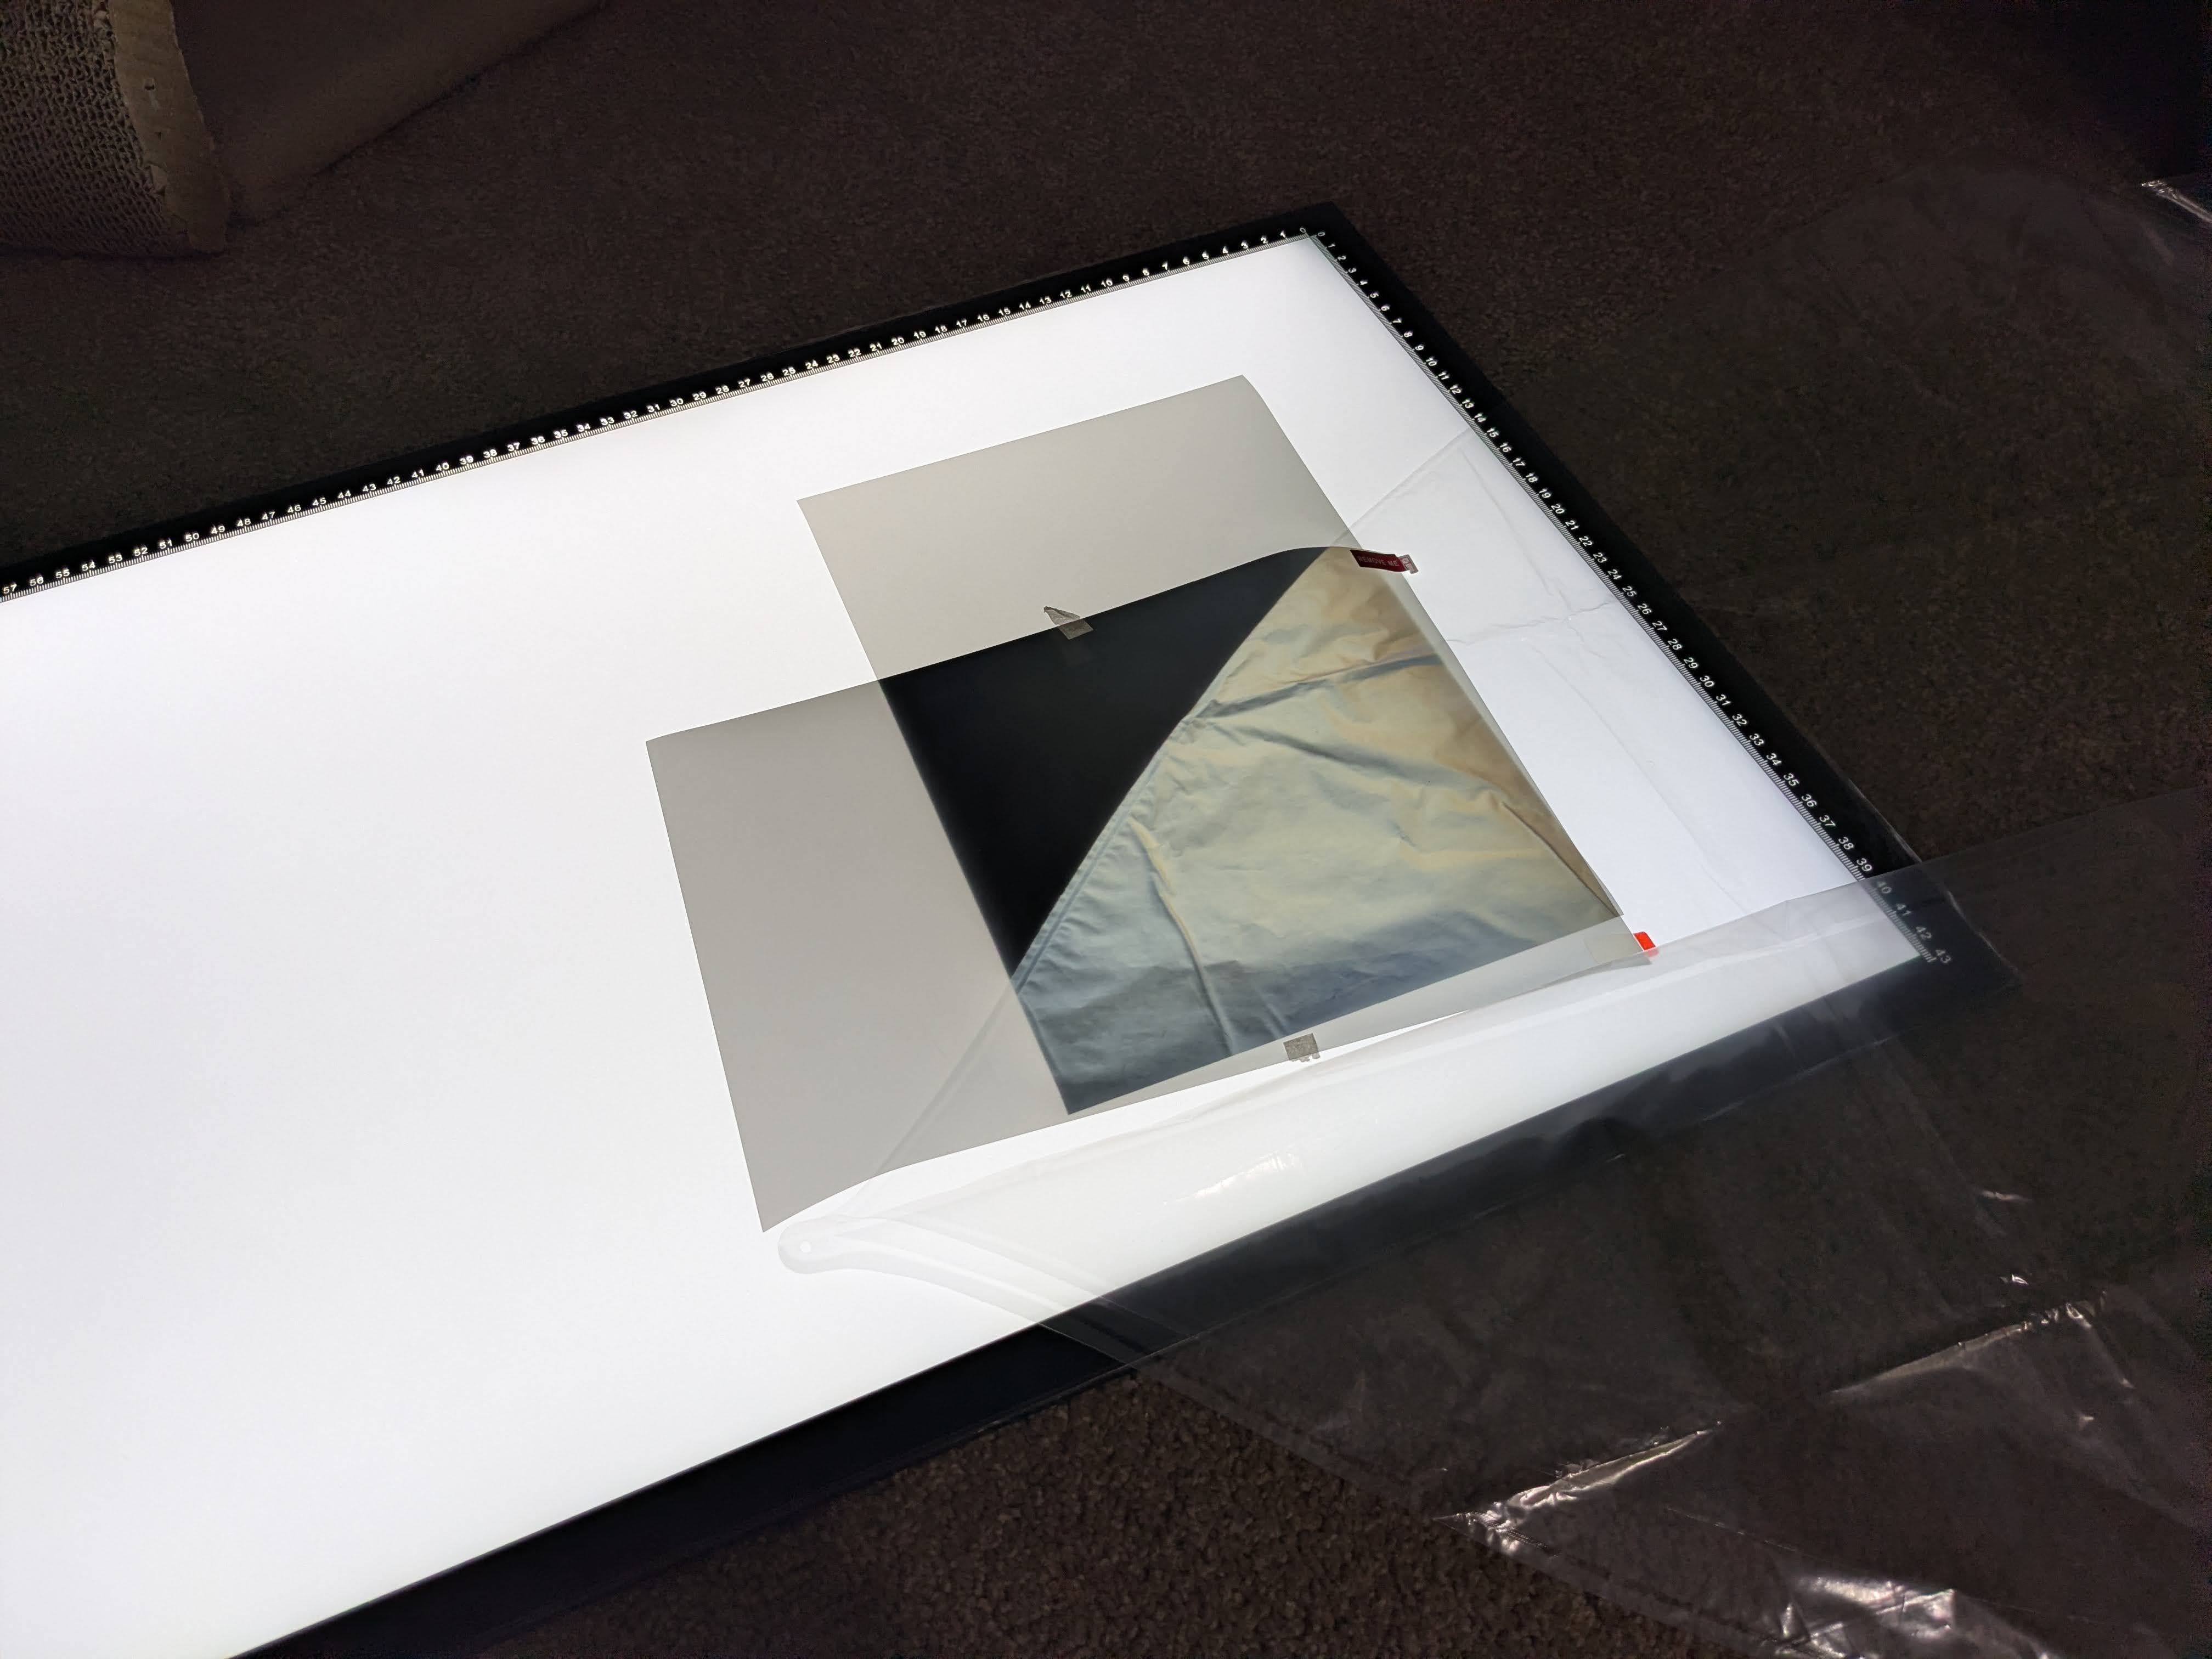 The complete birefringence imaging setup: an LED tracing light pad provides uniform backlight, a linear polarizer film sits on top, the balloon film sample goes in the middle, and a second polarizer (analyzer) is placed on the camera side. Total cost excluding camera: ~$30.
The components:
- Light source — An LED tracing light pad (the kind used for drawing/tracing). These provide uniform, diffuse white light across a large area — perfect for transmission imaging.
- Polarizer — A sheet of linear polarizer film placed on top of the light pad. This polarizes all the light going up through the sample.
- Sample — The balloon film, laid flat on the polarizer.
- Analyzer — A second sheet of linear polarizer film, placed on the camera side. When rotated 90° to the first polarizer (“crossed”), it blocks all light except what has been rotated by birefringent stress in the sample.
That’s it. No microscope, no special optics, no expensive equipment. The camera (phone or DSLR) just photographs through the analyzer.
What the Images Show
Here’s the same flaw in a balloon envelope viewed through different configurations. The difference is striking.
Without Polarization
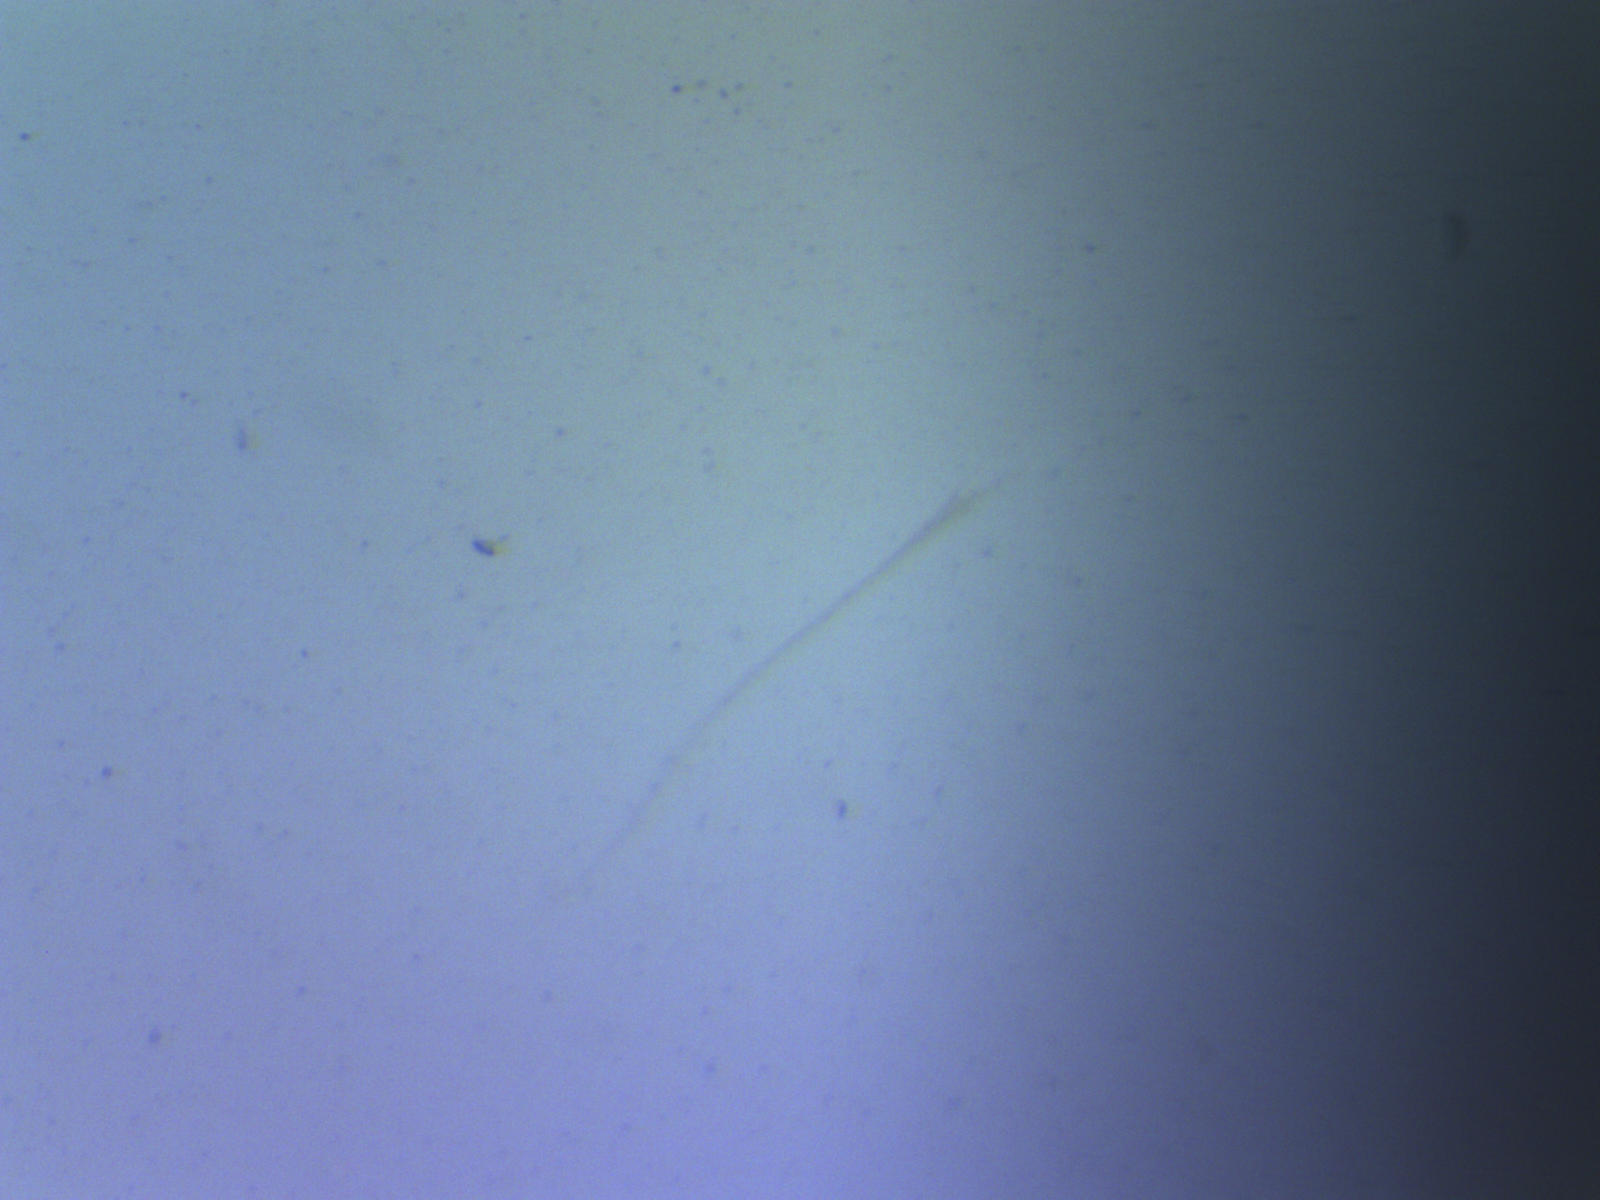 No polarizers at all — just backlit film. The flaw is barely visible, if at all. Standard visual inspection would likely miss this.
Polarizer Only (No Analyzer)
 Single polarizer, no analyzer. The light is now polarized but there’s nothing to convert the birefringence into visible contrast. Still very little to see.
Cross-Polarized (0°)
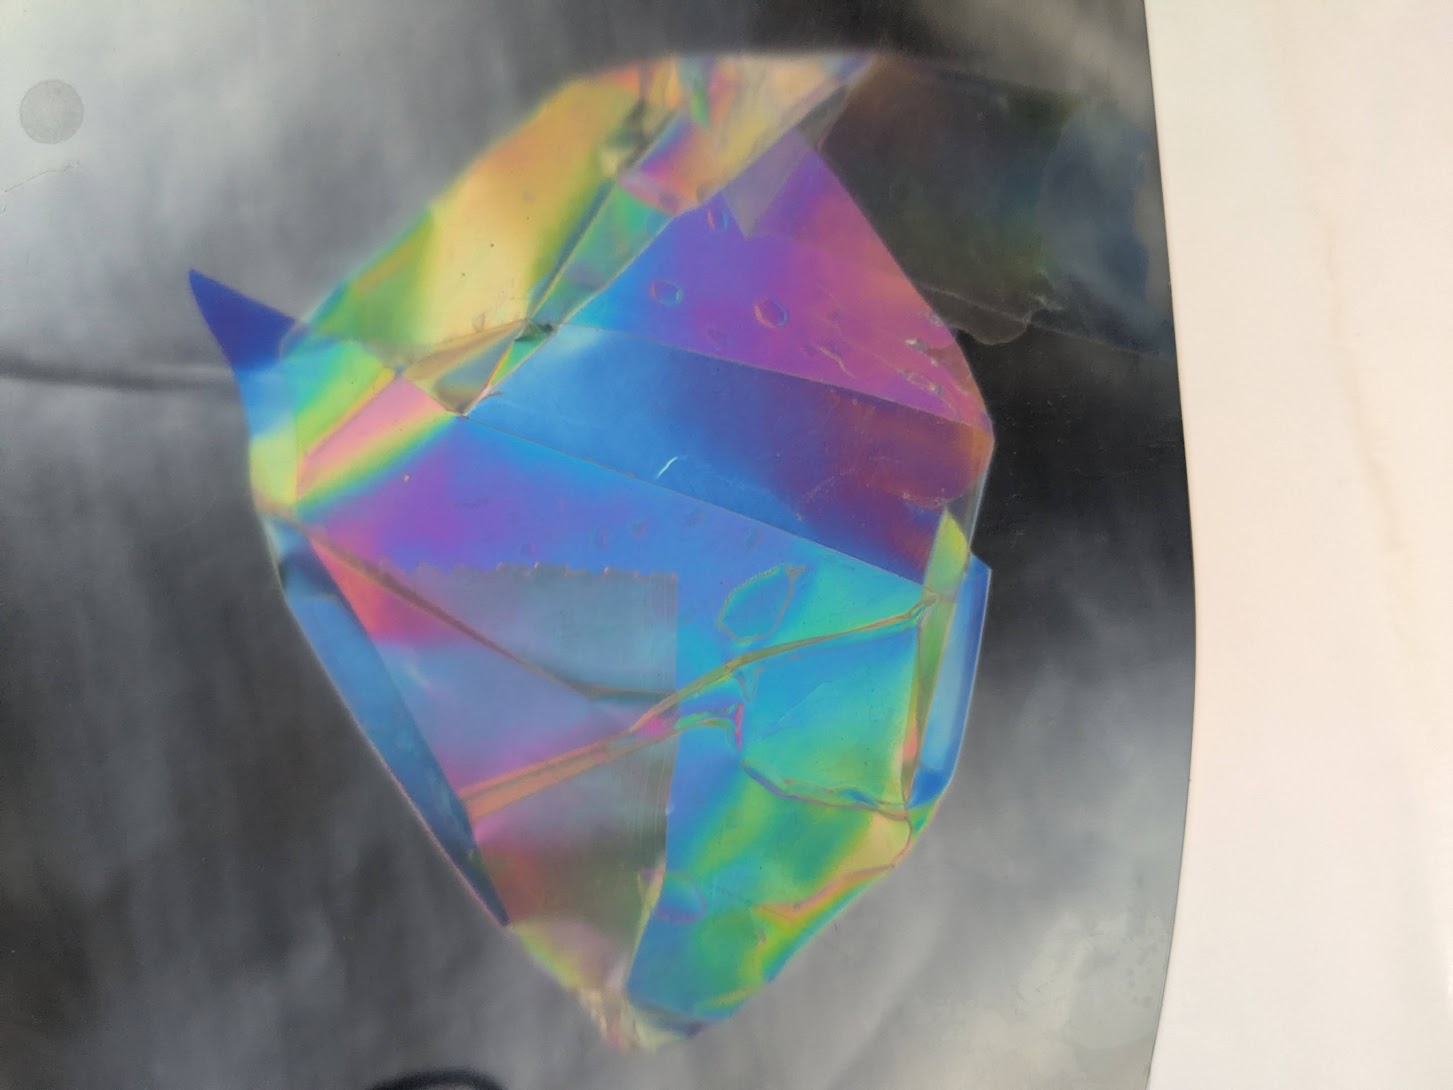
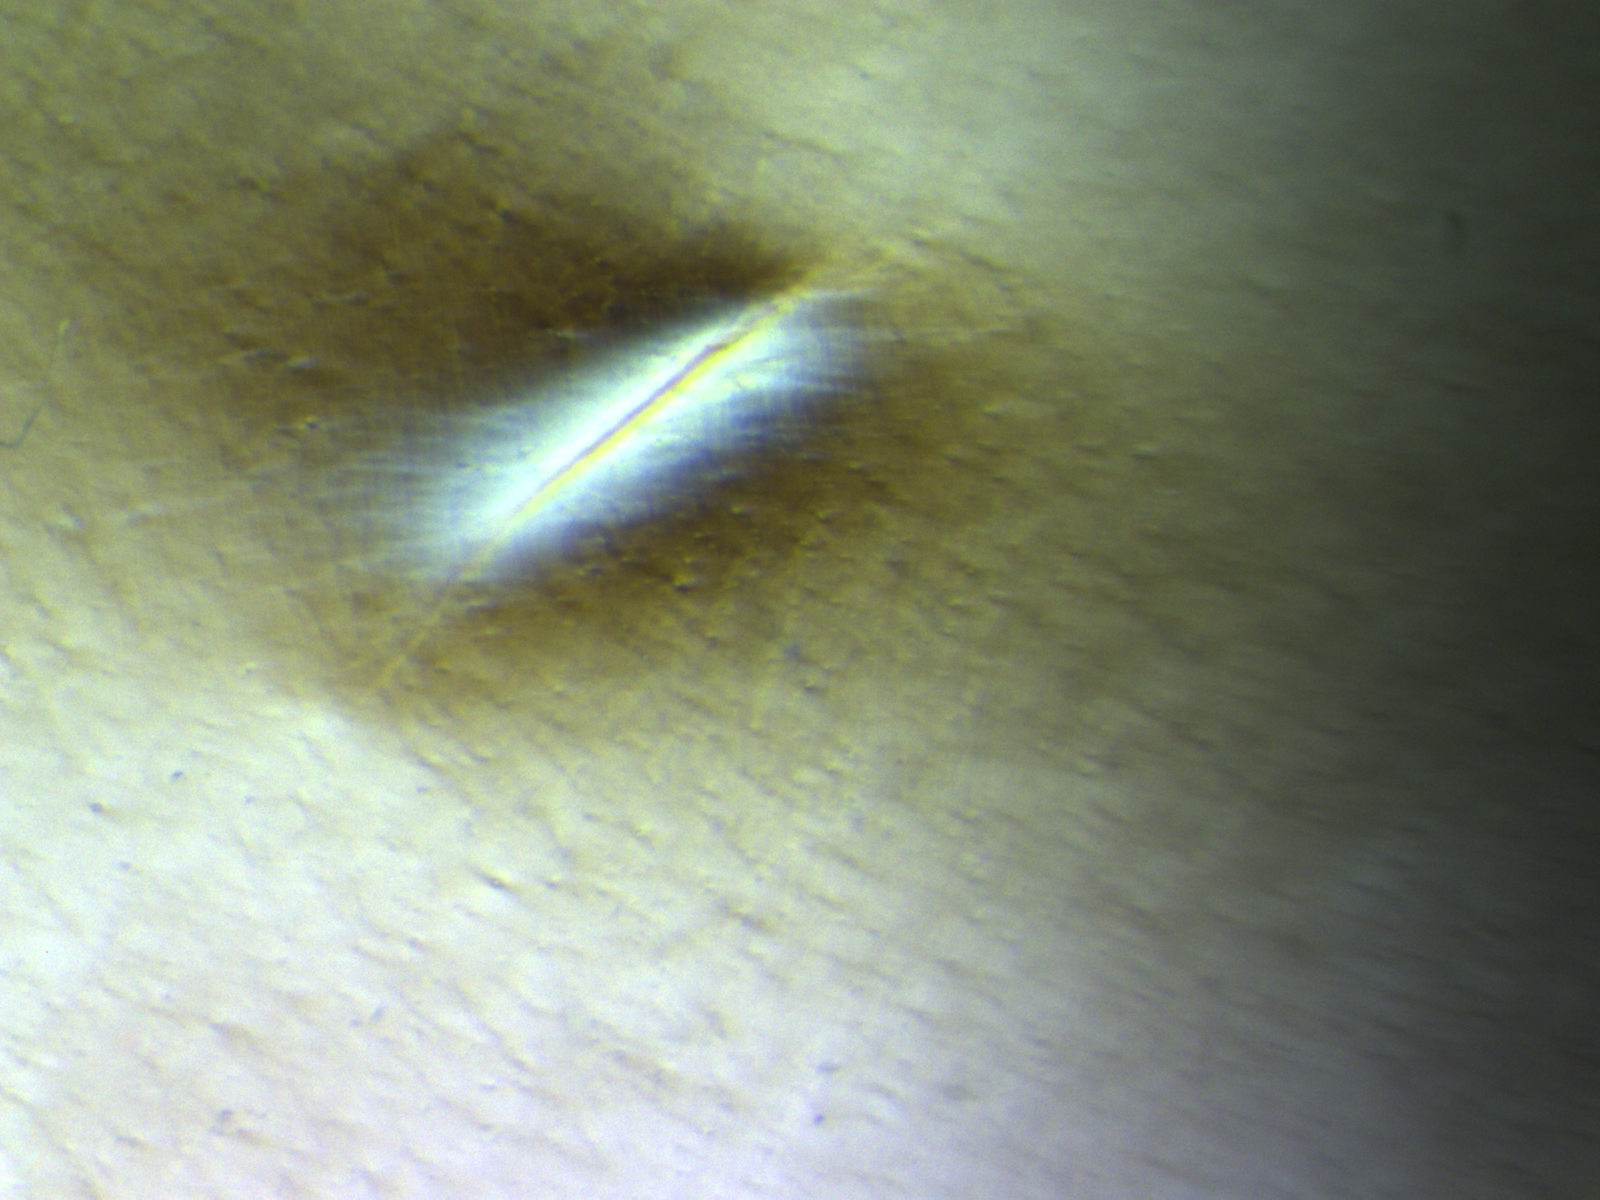 Crossed polarizers at 0° orientation. The flaw explodes into visibility. The interference colors reveal the stress field around the defect — the pattern of colors maps directly to the magnitude and direction of internal stress via the Michel-Lévy chart.
Cross-Polarized (90°)
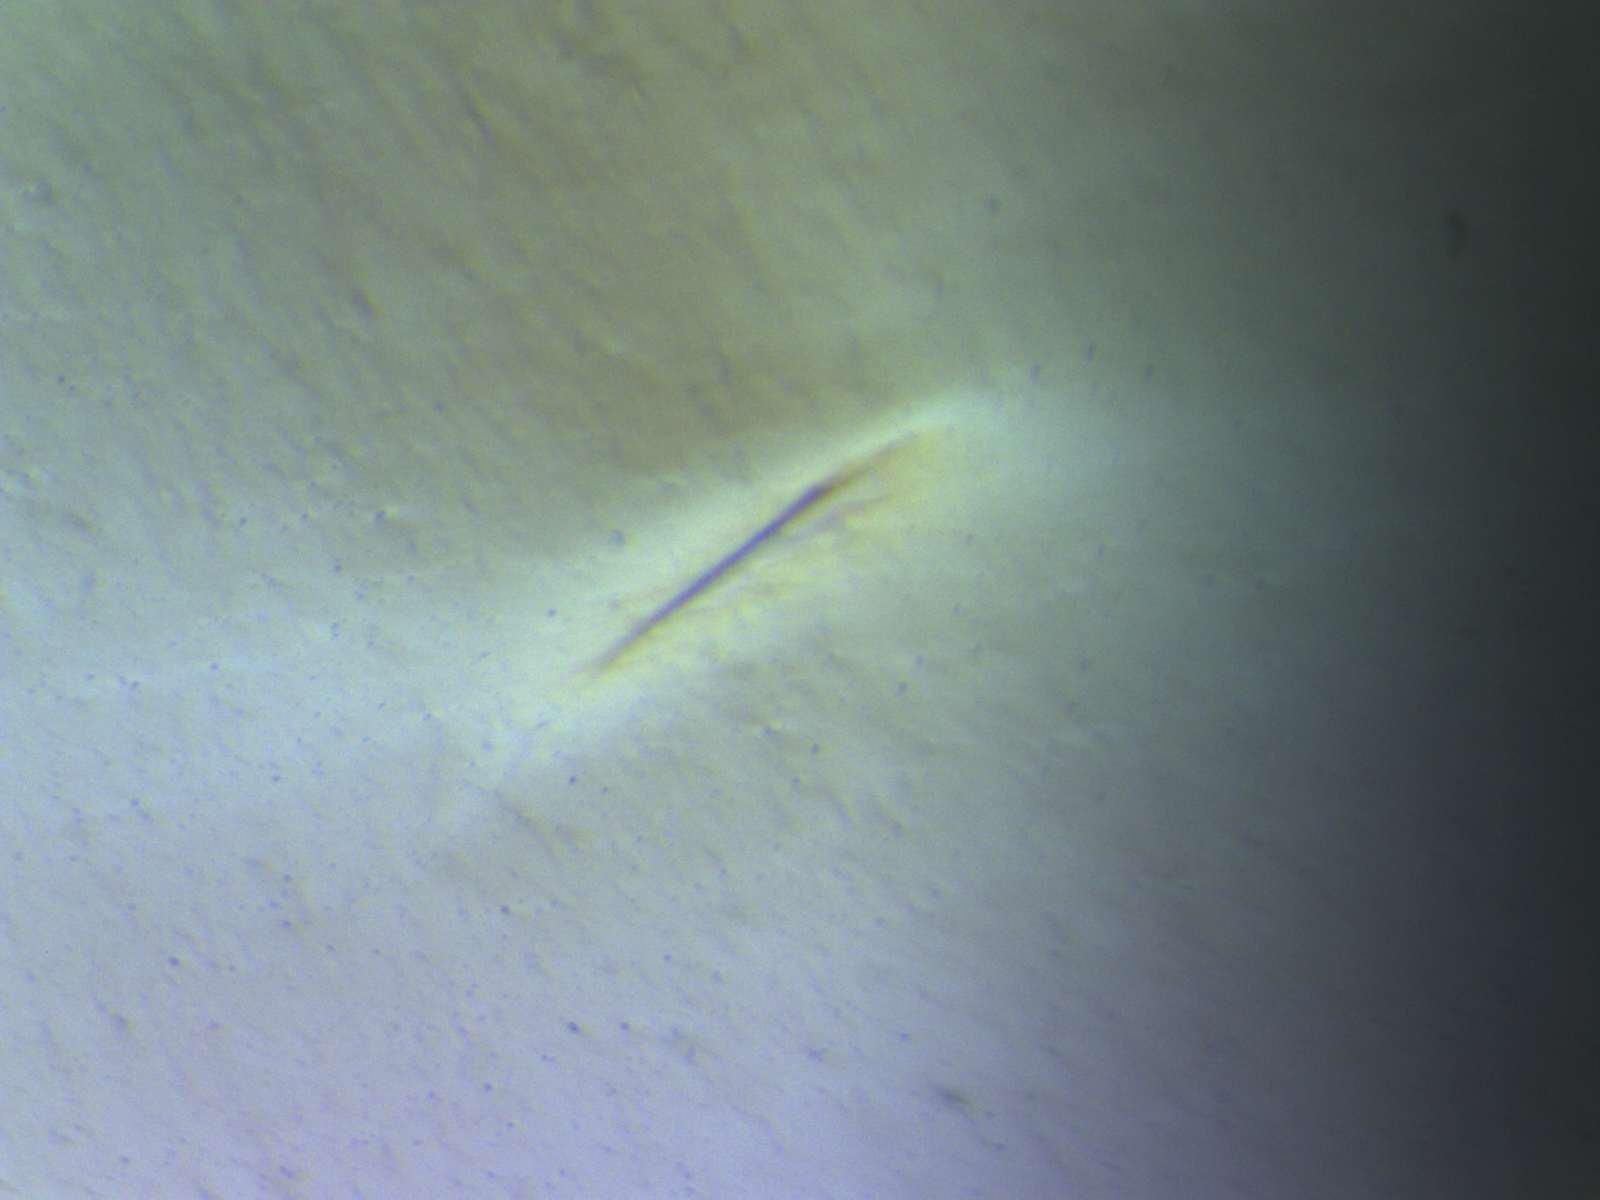
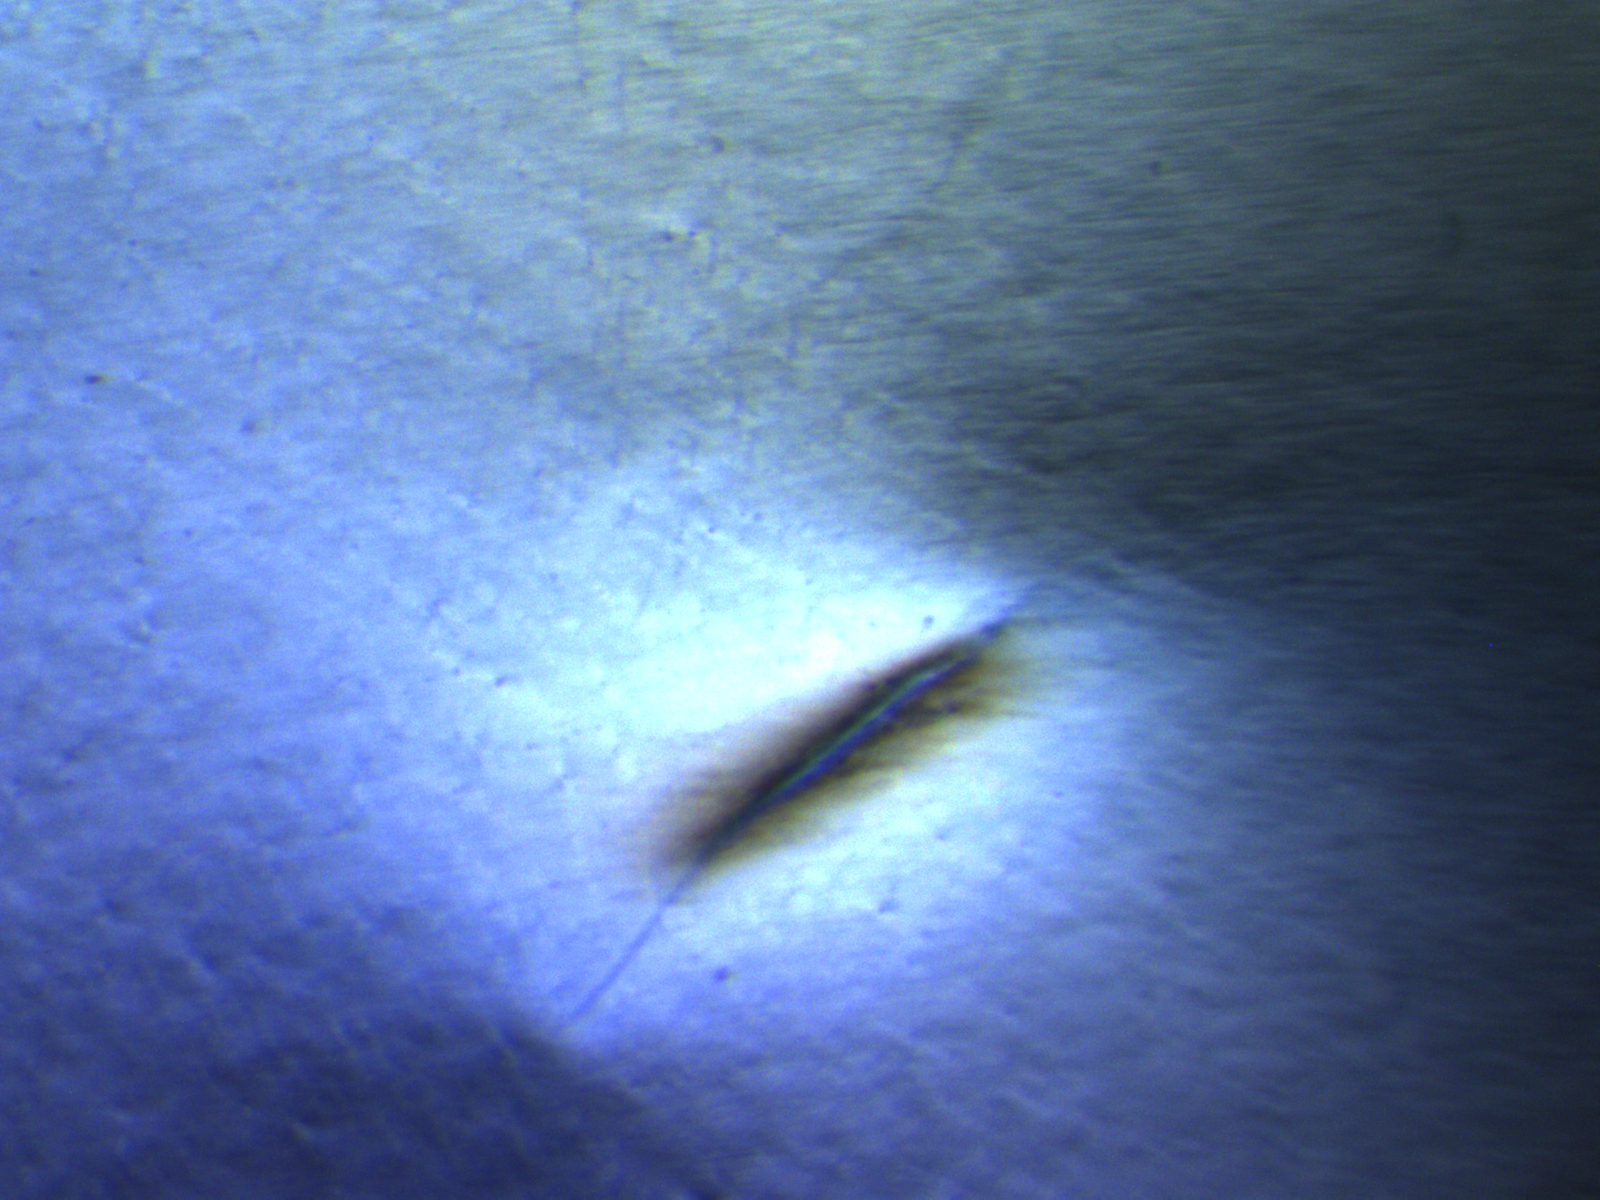 Crossed polarizers rotated 90° from the previous image. The color pattern shifts — this is the isocline effect. The dark extinction bands (isoclines) appear where the principal stress directions align with the polarizer axes. Rotating the sample or polarizers moves the isoclines, revealing the full stress field pattern.
Naked Eye Through Polarizers
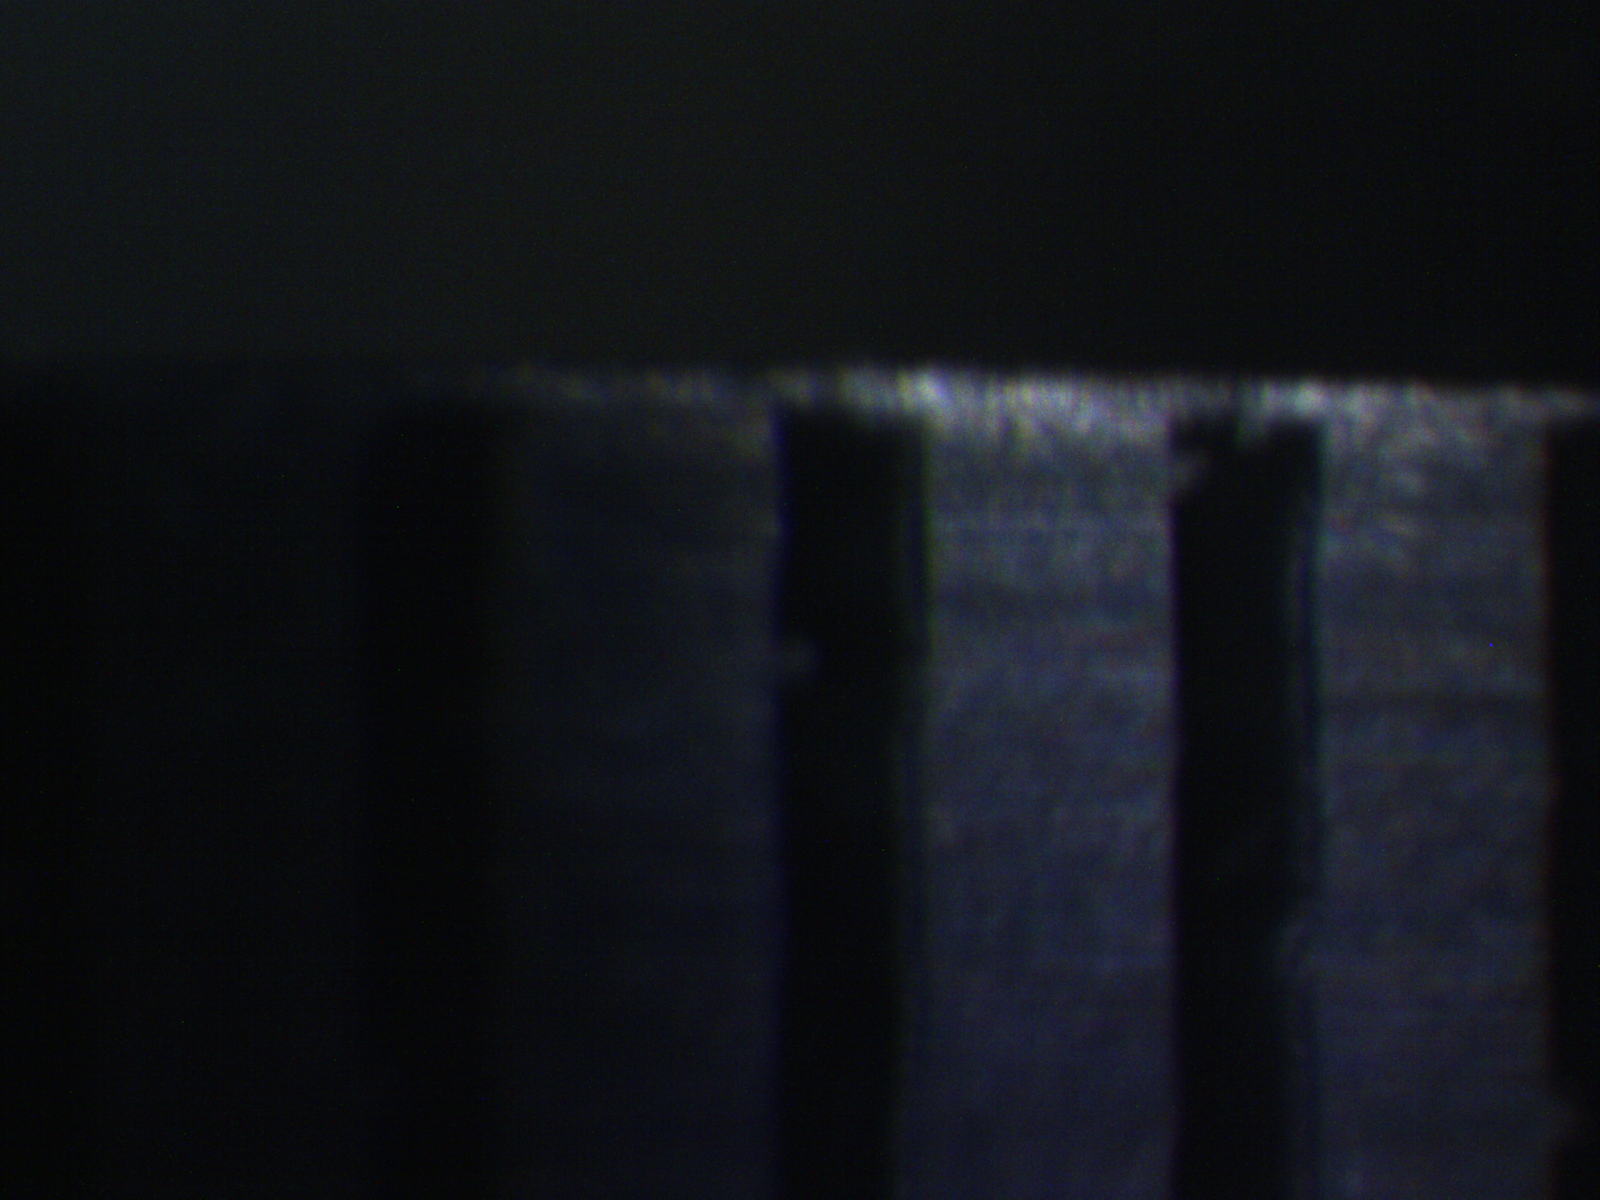
 What the flaw looks like by naked eye through the crossed polarizers. Even without a camera, the birefringence pattern is clearly visible — making this a practical handheld inspection technique.
Scale Reference
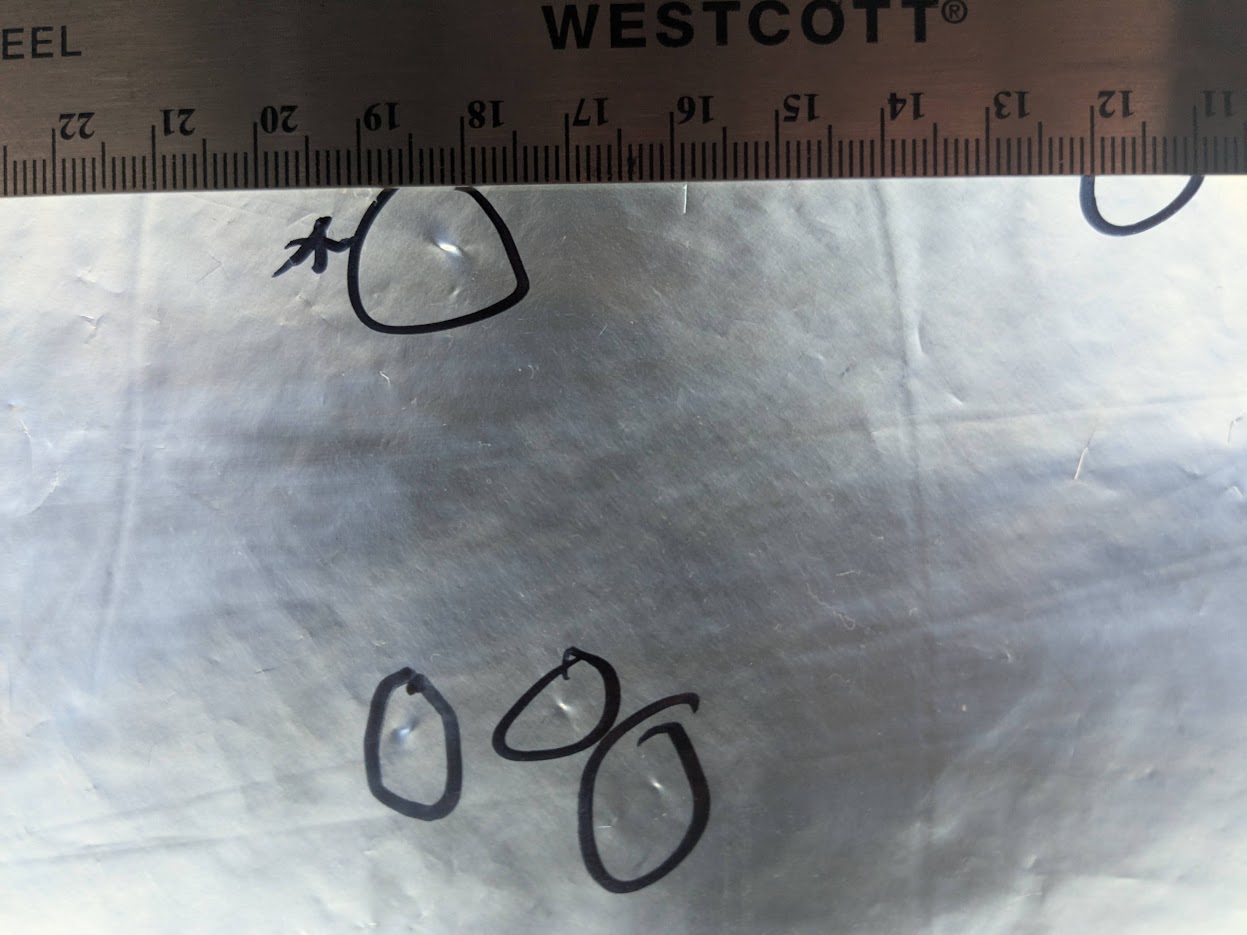
 Scale in millimeters. The stress field extends well beyond the visible flaw, creating a halo of birefringence several millimeters across.
Reading the Colors
In the cross-polarized images, the colors around the flaw tell a story:
- Black regions — No stress, or stress aligned exactly with the polarizer/analyzer axes (isoclines). Rotating the polarizers would make these regions light up and others go dark.
- Grey/white — Low first-order retardation. Mild stress — the material is slightly strained but well within its elastic range.
- Yellow/orange — Higher first-order retardation. Moderate stress concentration.
- Red/magenta — The boundary between first and second order (~550 nm retardation). This is a significant stress level.
- Blue/green — Second-order colors. High stress — the material is substantially strained in this region.
The spatial pattern matters as much as the colors. A smooth, symmetric color gradient around a point defect suggests a simple stress concentration (like a bubble or inclusion). Asymmetric or streaky patterns might indicate manufacturing defects in the film drawing process, crease damage, or seam stress.
Can Flaws Predict Failure?
This is the key question and the next step in this work. The birefringence setup reveals flaws that are invisible to the naked eye and to standard backlit inspection. But seeing a flaw doesn’t tell you whether it matters — not every stress concentration becomes a pinhole, and not every pinhole causes a burst.
The plan is to:
-
Categorize — Survey multiple balloon envelopes and build a taxonomy of flaw types visible under cross-polarized light. Point defects, line defects, seam stress, crease damage, manufacturing streaks — each type likely has different implications.
-
Map — Record the location and type of each flaw on a balloon before inflation testing.
-
Correlate — After inflation testing (using the inflation rig and DIC strain analysis), check whether mapped flaws correspond to pinhole locations, strain concentration hotspots, or burst initiation points.
-
Predict — If specific flaw types reliably predict failure, birefringence inspection becomes a pre-flight screening tool. Reject or reinforce balloons with critical flaws before they ever fly.
This is early-stage work — I have the imaging setup working and the first flaw observations, but the correlation with actual failure data is still ahead. The balloon catalog already tracks strain concentration from DIC analysis; adding pre-inflation birefringence maps would create a direct comparison between predicted and actual stress fields.
The beauty of cross-polarized imaging is its simplicity. A light pad and two sheets of polarizer film turn invisible manufacturing defects into vivid color maps. If even a fraction of the early picoballoon failures trace back to flaws that were detectable all along, this $30 setup could save a lot of helium and frustration.
Related Posts
- Balloon Inflation Testing — The inflation rig, stereo vision capture, DIC strain analysis, and the live balloon catalog
- Balloon Float Calculator — The physics of superpressure balloon flight
- Welcome to Stratosonde — Project overview and goals