Frost-Point Humidity Calibration for the Stratosphere: What NBS Knew in 1973 and What I Learned the Hard Way
Frost-Point Humidity Calibration for the Stratosphere: What NBS Knew in 1973 and What I Learned the Hard Way
In the previous post, the AD7746 + DHP14 + PT1000 sensor system demonstrated 0.09% RH repeatability at a single calibration point—room temperature, moderate humidity, controlled conditions. The results were genuinely promising. But as noted at the end of that post, the critical unanswered question was always the same: does any of this work at -56.5°C and sub-1% RH?
This post documents three attempts to answer that question by building a low frost-point calibration system inspired by a 1973 National Bureau of Standards design. All three attempts failed, but each failure mode reveals something different. This is a detailed accounting of why they failed, what the failures taught, and how the next iteration will be different.
Engineering is iteration. The value of a failed experiment is proportional to how precisely you understand the failure mode.
The Greenspan Generator: How NBS Did It Right
In 1973, Lewis Greenspan at the National Bureau of Standards (now NIST) published “Low Frost-Point Humidity Generator” in the Journal of Research of the NBS (Vol. 77A, No. 5). The paper describes a calibration facility developed under NASA Viking Project funding—the same program that sent landers to Mars. NASA needed to calibrate humidity sensors for planetary atmosphere measurements, and the existing state of the art wasn’t good enough.
Greenspan’s generator operates on an elegant principle: flow dry carrier gas through a long stainless steel tube whose interior walls are coated with a uniform layer of ice, all held at a precisely known temperature. The gas reaches thermodynamic equilibrium with the ice surface, exiting at a known frost-point temperature. Feed that gas into a separate, independently temperature-controlled test chamber containing the sensor under calibration, and you have a traceable humidity reference.
Key specifications of the NBS system:
| Parameter | NBS Generator |
|---|---|
| Frost-point range | -30°C to -100°C |
| Saturator tube | 16 ft of 3/8” SS tubing, helical coil |
| Ice coating area | ~1200 cm² interior surface |
| Gas transit time | ~7 seconds at 2 L/min |
| Frost-point uncertainty | ±0.05°C |
| Equilibration time | 16 hours minimum |
| Ice coating procedure | 7+ hours, progressive cooling |
| Bath fluid | Five-component cryogenic mixture, liquid to -130°C |
| Test chamber walls | Gold-plated stainless steel |
| Pressure range | 500 to 200,000 Pa |
| Construction | Exclusively stainless steel, welded bellows valves |
Several details from Greenspan’s paper deserve emphasis because they directly explain why my simplified adaptation failed:
The ice coating procedure is not trivial. Greenspan didn’t simply flow wet air through a cold tube. The interior of the entire generator was first dried by flowing dry gas for weeks at room temperature, or shorter periods with the generator in a 100°C oven. The coating was then applied at -100°C by progressively immersing the saturator coil in the cryogenic bath at a controlled rate of 15/16 inch per hour over 7+ hours, providing a continuously fresh condensation surface. This created a uniform ice layer approximately 1 mm thick across the full 1200 cm² interior.
Sixteen hours is the minimum equilibration time. After coating, the exit tubing was dried for 12-16 hours with heated dry air at 100°C. Then fixed conditions were maintained for at least 16 additional hours before any measurements were attempted. Greenspan selected this interval to allow a condition change daily while ensuring adequate equilibration—a practical concession acknowledging that achieving true frost-point equilibrium at very low temperatures and pressures is inherently slow.
Gold-plated test chamber walls. The test chamber interior, including the cover, was gold-plated to reduce water vapor adsorption on stainless steel surfaces—a detail that reveals just how seriously surface adsorption affects low-humidity measurements. At sub-ppm moisture levels, the walls themselves become significant moisture sources or sinks.
The validation took days. Greenspan’s gravimetric verification runs—weighing the collected moisture against the carrier gas consumed—required 7-8 days per run at frost points of -49°C and -55°C. These weren’t quick spot-checks; they were multi-day experiments where “the experiment becomes as much a test of the durability of apparatus and equipment as it is of the humidity.”
My Adaptation: A 6-Foot Tube and Optimism
Inspired by the Greenspan architecture, I set out to build a simplified version using the temperature chamber already on hand from the battery and capacitor characterization tests documented in previous posts.
The setup:
- Saturator tube: 6 ft of 1/2” stainless steel tubing, single coil inside the temperature chamber
- Test box: Enclosed volume containing the DHP14 humidity sensor and PT1000 RTD, placed inside the temperature chamber
- Heater: Resistive heater element positioned beneath the test box
- Temperature reference: PT1000 Class A RTD via AD7746 voltage channel, plus AD7746 internal temperature sensor
- Data acquisition: Raspberry Pi Pico W running MicroPython, logging at ~1 Hz
- Carrier gas: Ambient air, humidified by passage over water/ice
The concept was straightforward: cool the SS tube to sub-zero temperatures in the chamber, pass humidified air through it so moisture would frost onto the interior walls and the exiting gas would be at a known frost point, then measure the resulting humidity in the test box with the DHP14/AD7746 system. The heater underneath the test box was intended to create a temperature differential between the saturator (cold) and the test chamber (less cold)—necessary because relative humidity depends on both the frost-point temperature and the measurement temperature.
The data format from the logger captures the full measurement chain:
Timestamp,Elapsed_s,Raw_Cap_Hex,Capacitance_pF,Humidity_%RH,Raw_VT_RTD_Hex,Temperature_RTD_C,Raw_VT_Int_Hex,Temperature_Int_C
2026-02-13 09:30:46,0.000,0x3F1158,154.1987,3.3908,0x8E179C,23.6484,0x80C3E6,24.4873
2026-02-13 09:30:47,2.000,0x3F0ECB,154.1910,3.3831,0x8E14E0,23.4336,0x80C467,24.5503
2026-02-13 09:30:48,3.000,0x3F0FDB,154.1910,3.3972,0x8E159F,23.4922,0x80C444,24.5332
Each sample captures raw 24-bit hex values alongside calibrated readings: capacitance in picofarads, derived humidity in %RH, PT1000 RTD temperature, and the AD7746’s internal die temperature. The dual temperature channels became important—more on that below.
Test 1: The Heater Differential Approach — What the Data Reveals
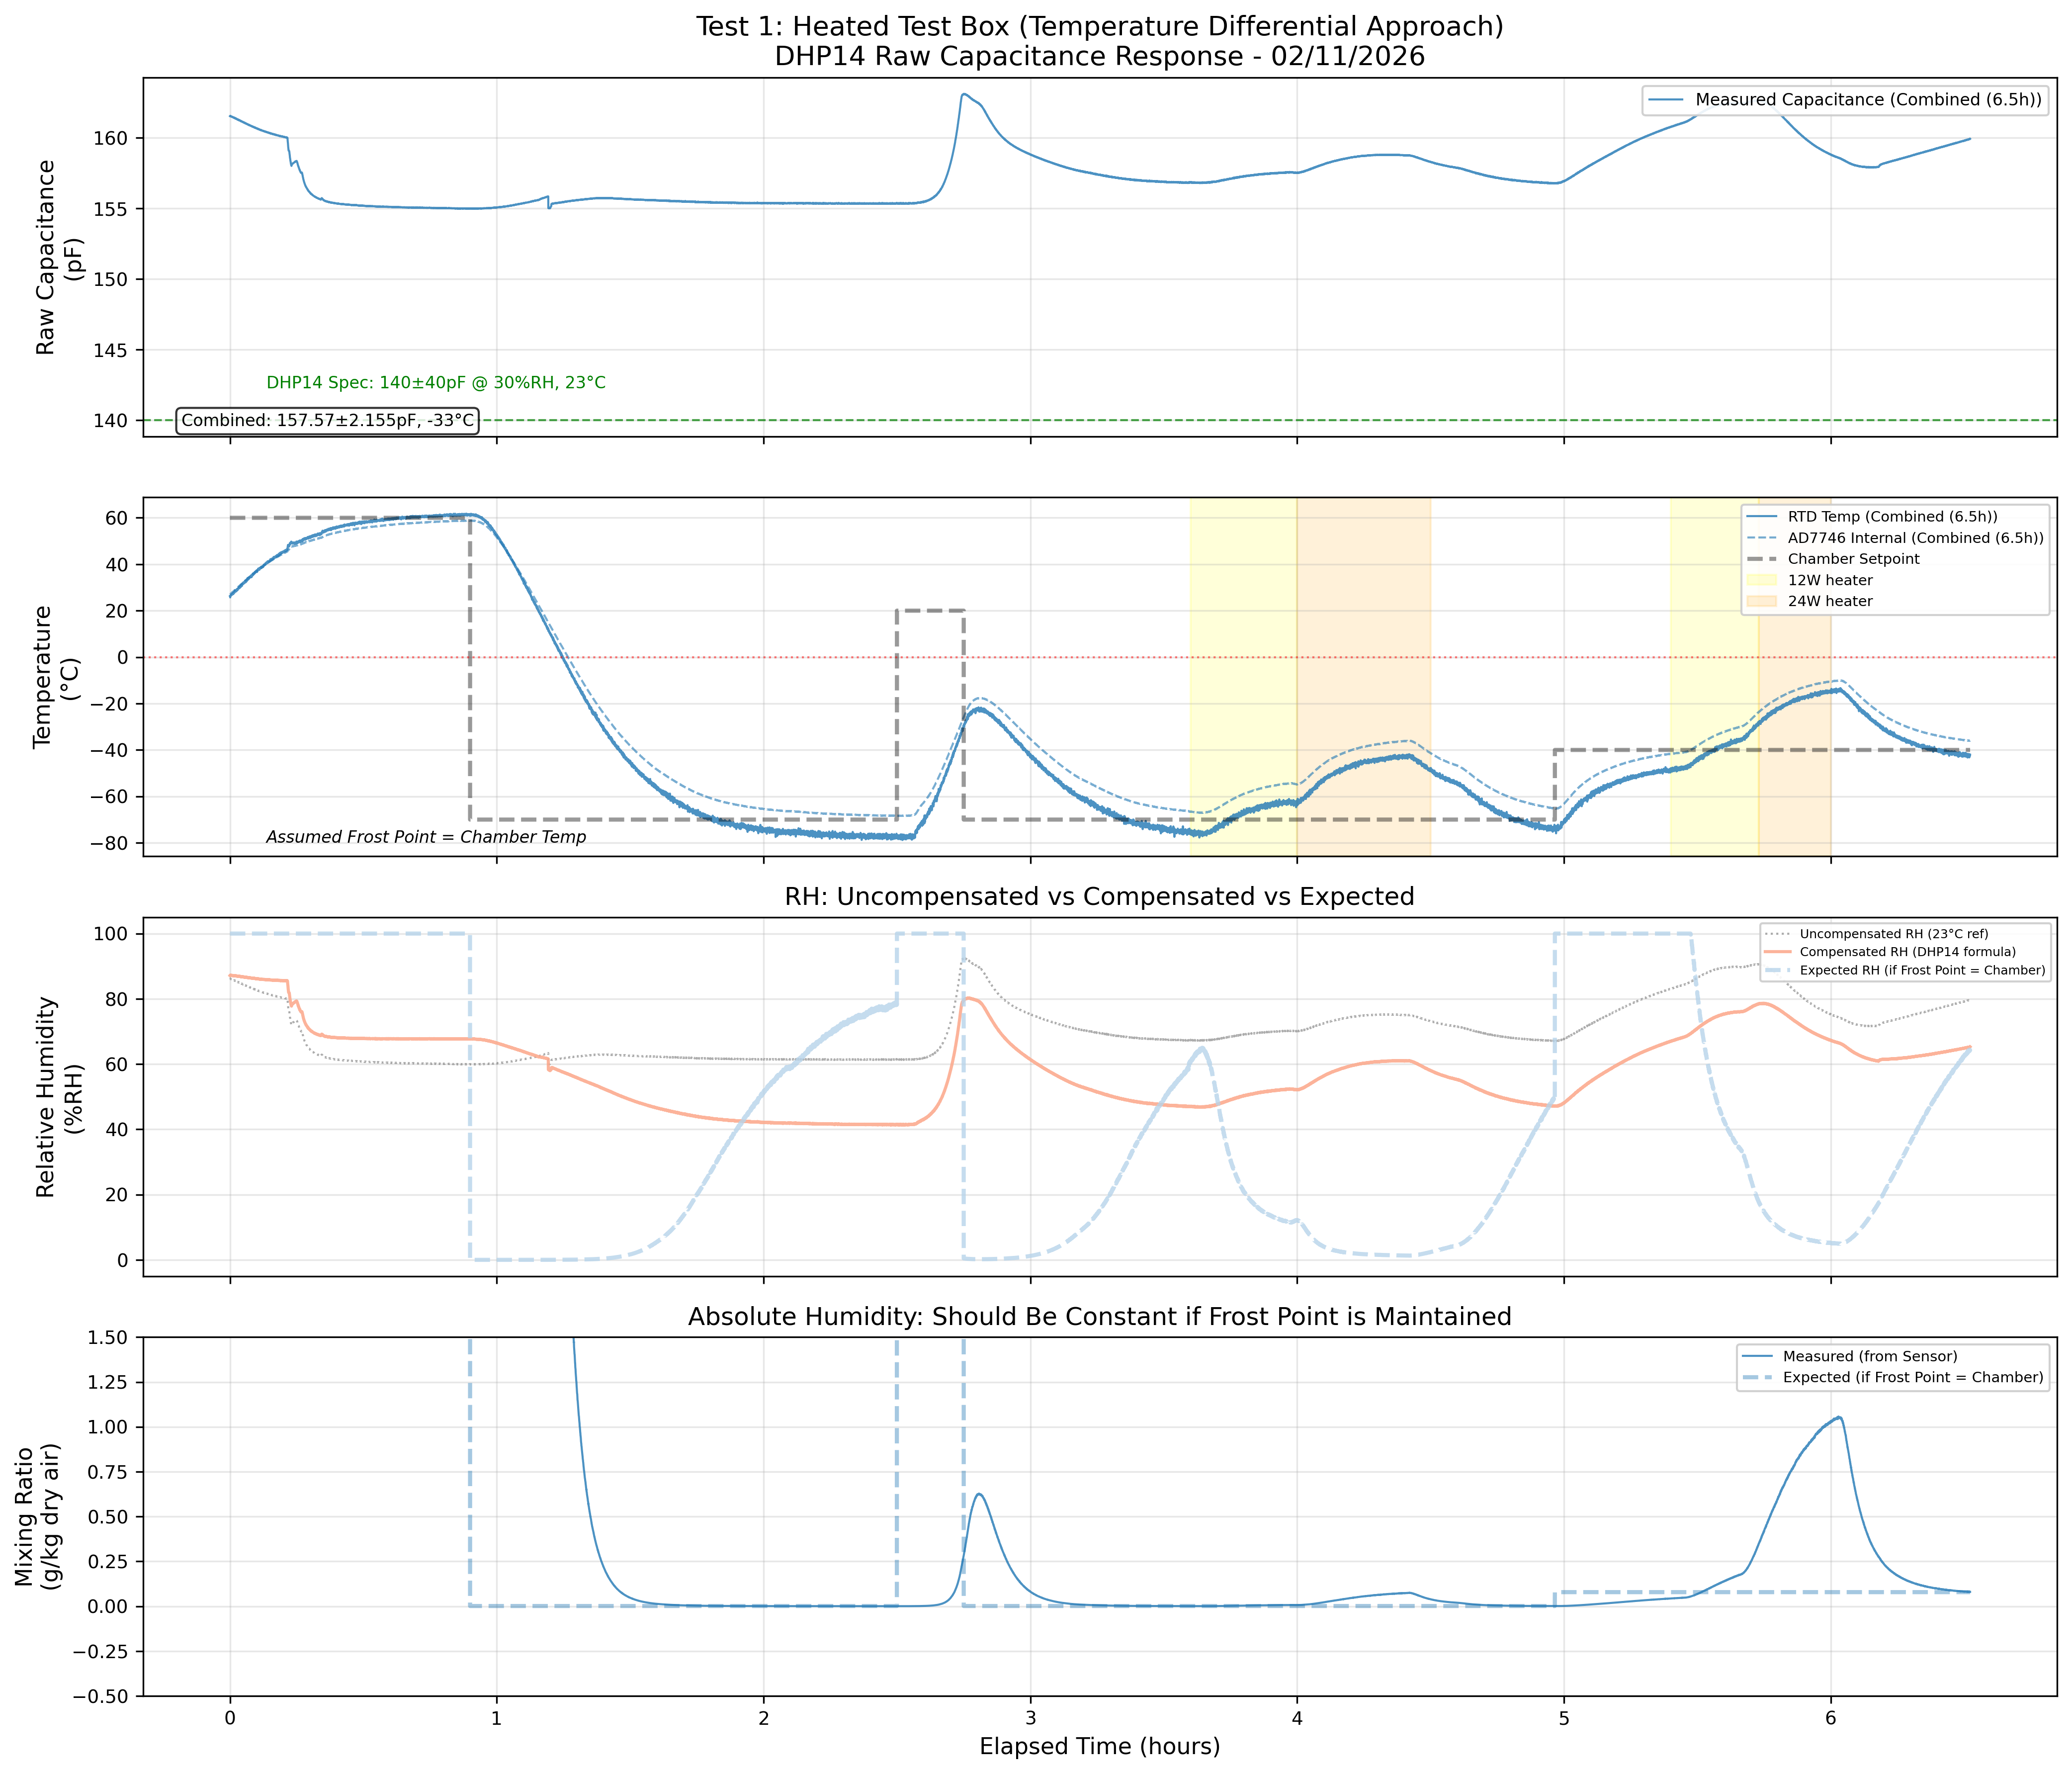
The first test (February 11, 6.5 hours, 19,297 samples) was designed to validate a fundamental assumption: if the frost point generator maintains a constant frost point, absolute humidity should remain constant even as sensor temperature changes.
The experimental design was straightforward:
- Set chamber temperature to -70°C (intended frost point)
- Vary test box temperature in three phases: 0W heater (ambient), 12W heater (+warmer), 24W heater (++warmer)
- Expected: If frost point = -70°C throughout, the calculated absolute humidity should be flat across all three heater phases
The hypothesis: Cold air saturated at -70°C is passed through the test box. As the heater warms the sensor, relative humidity should drop (warm air can hold more moisture), but the absolute moisture content should remain constant. We can work backwards from capacitance→RH→absolute humidity to verify if the system is maintaining equilibrium.
What Physics Says Should Happen
If the frost point generator is working correctly:
- Panel 1 (Capacitance): Will drop as sensor warms (lower RH at higher temp for same absolute humidity)
- Panel 2 (Temperature): Shows chamber at -70°C, sensor temperature rising with heater power
- Panel 3 (Relative Humidity): Compensated RH should track expected based on chamber temp and sensor temp
- Panel 4 (Absolute Humidity): Should be flat horizontal lines — mixing ratio is temperature-independent
What The Data Actually Shows
Panel 4 — The Smoking Gun:
The absolute humidity (mixing ratio in g/kg dry air) is not flat. Instead of maintaining constant absolute moisture content across the three heater phases, the mixing ratio drifts significantly. The blue dashed “Expected” line (assuming chamber temperature = frost point) diverges from the measured values.
This is the calibration failure made visible. If the frost point were truly constant at -70°C, both lines would show constant absolute humidity of ~0.08 g/kg (saturation mixing ratio at -70°C). Instead, measured values are 10-20× higher and vary with heater power.
Panel 3 — Temperature Compensation Effect:
Three RH lines tell the story:
- Grey dotted: Uncompensated RH (just capacitance at 23°C reference)
- Red solid: Compensated RH (with DHP14 datasheet formula)
- Blue dashed: Expected RH (if chamber = frost point)
The compensated RH should match the expected line. It doesn’t. Even with correct temperature compensation, the divergence confirms the sensor is not measuring air at the expected frost point.
Panel 2 — Temperature Behavior:
The temperature traces show the AD7746 internal temperature sensor (dashed lines) varying between approximately -65°C and -45°C as heater power increases:
- Yellow (12W) and orange (24W) shaded regions indicate heater periods
- Chamber setpoint (black dashed steps) shows the intended -70°C
- Sensor temperature responds to heater power changes
The temperature differential is working as intended—the heater creates warmer conditions in the test box relative to the chamber temperature. But something is clearly wrong with the humidity measurements.
Panel 1 — The Sensor Works Fine:
The raw capacitance measurement is rock-solid: 157.57 ± 2.15 pF over 6.5 hours. This is excellent performance from the AD7746+DHP14 system—standard deviation of 2.15 pF represents measurement precision of ~0.5% of the total signal swing.
The sensor is working correctly. But the calibration reference isn’t.
Initial Interpretation: Maybe Insufficient Equilibration Time?
The first test ran for 6.5 hours, but perhaps that wasn’t long enough. Looking at the divergence between expected and measured absolute humidity, the initial hypothesis was that the system simply needed more time to reach thermal equilibrium.
Maybe the frost coating needed longer to build up uniformly. Maybe the moisture levels needed more time to stabilize throughout the system. The temperature control seemed stable enough, and the heater was creating the intended differential.
The sensor precision was excellent—2.15 pF standard deviation over 6.5 hours. If we just gave the system more time to settle, perhaps the humidity reference would stabilize at the expected values.
Working hypothesis after Test 1: The approach is sound, but equilibration time is insufficient. Solution: extend the stabilization period.
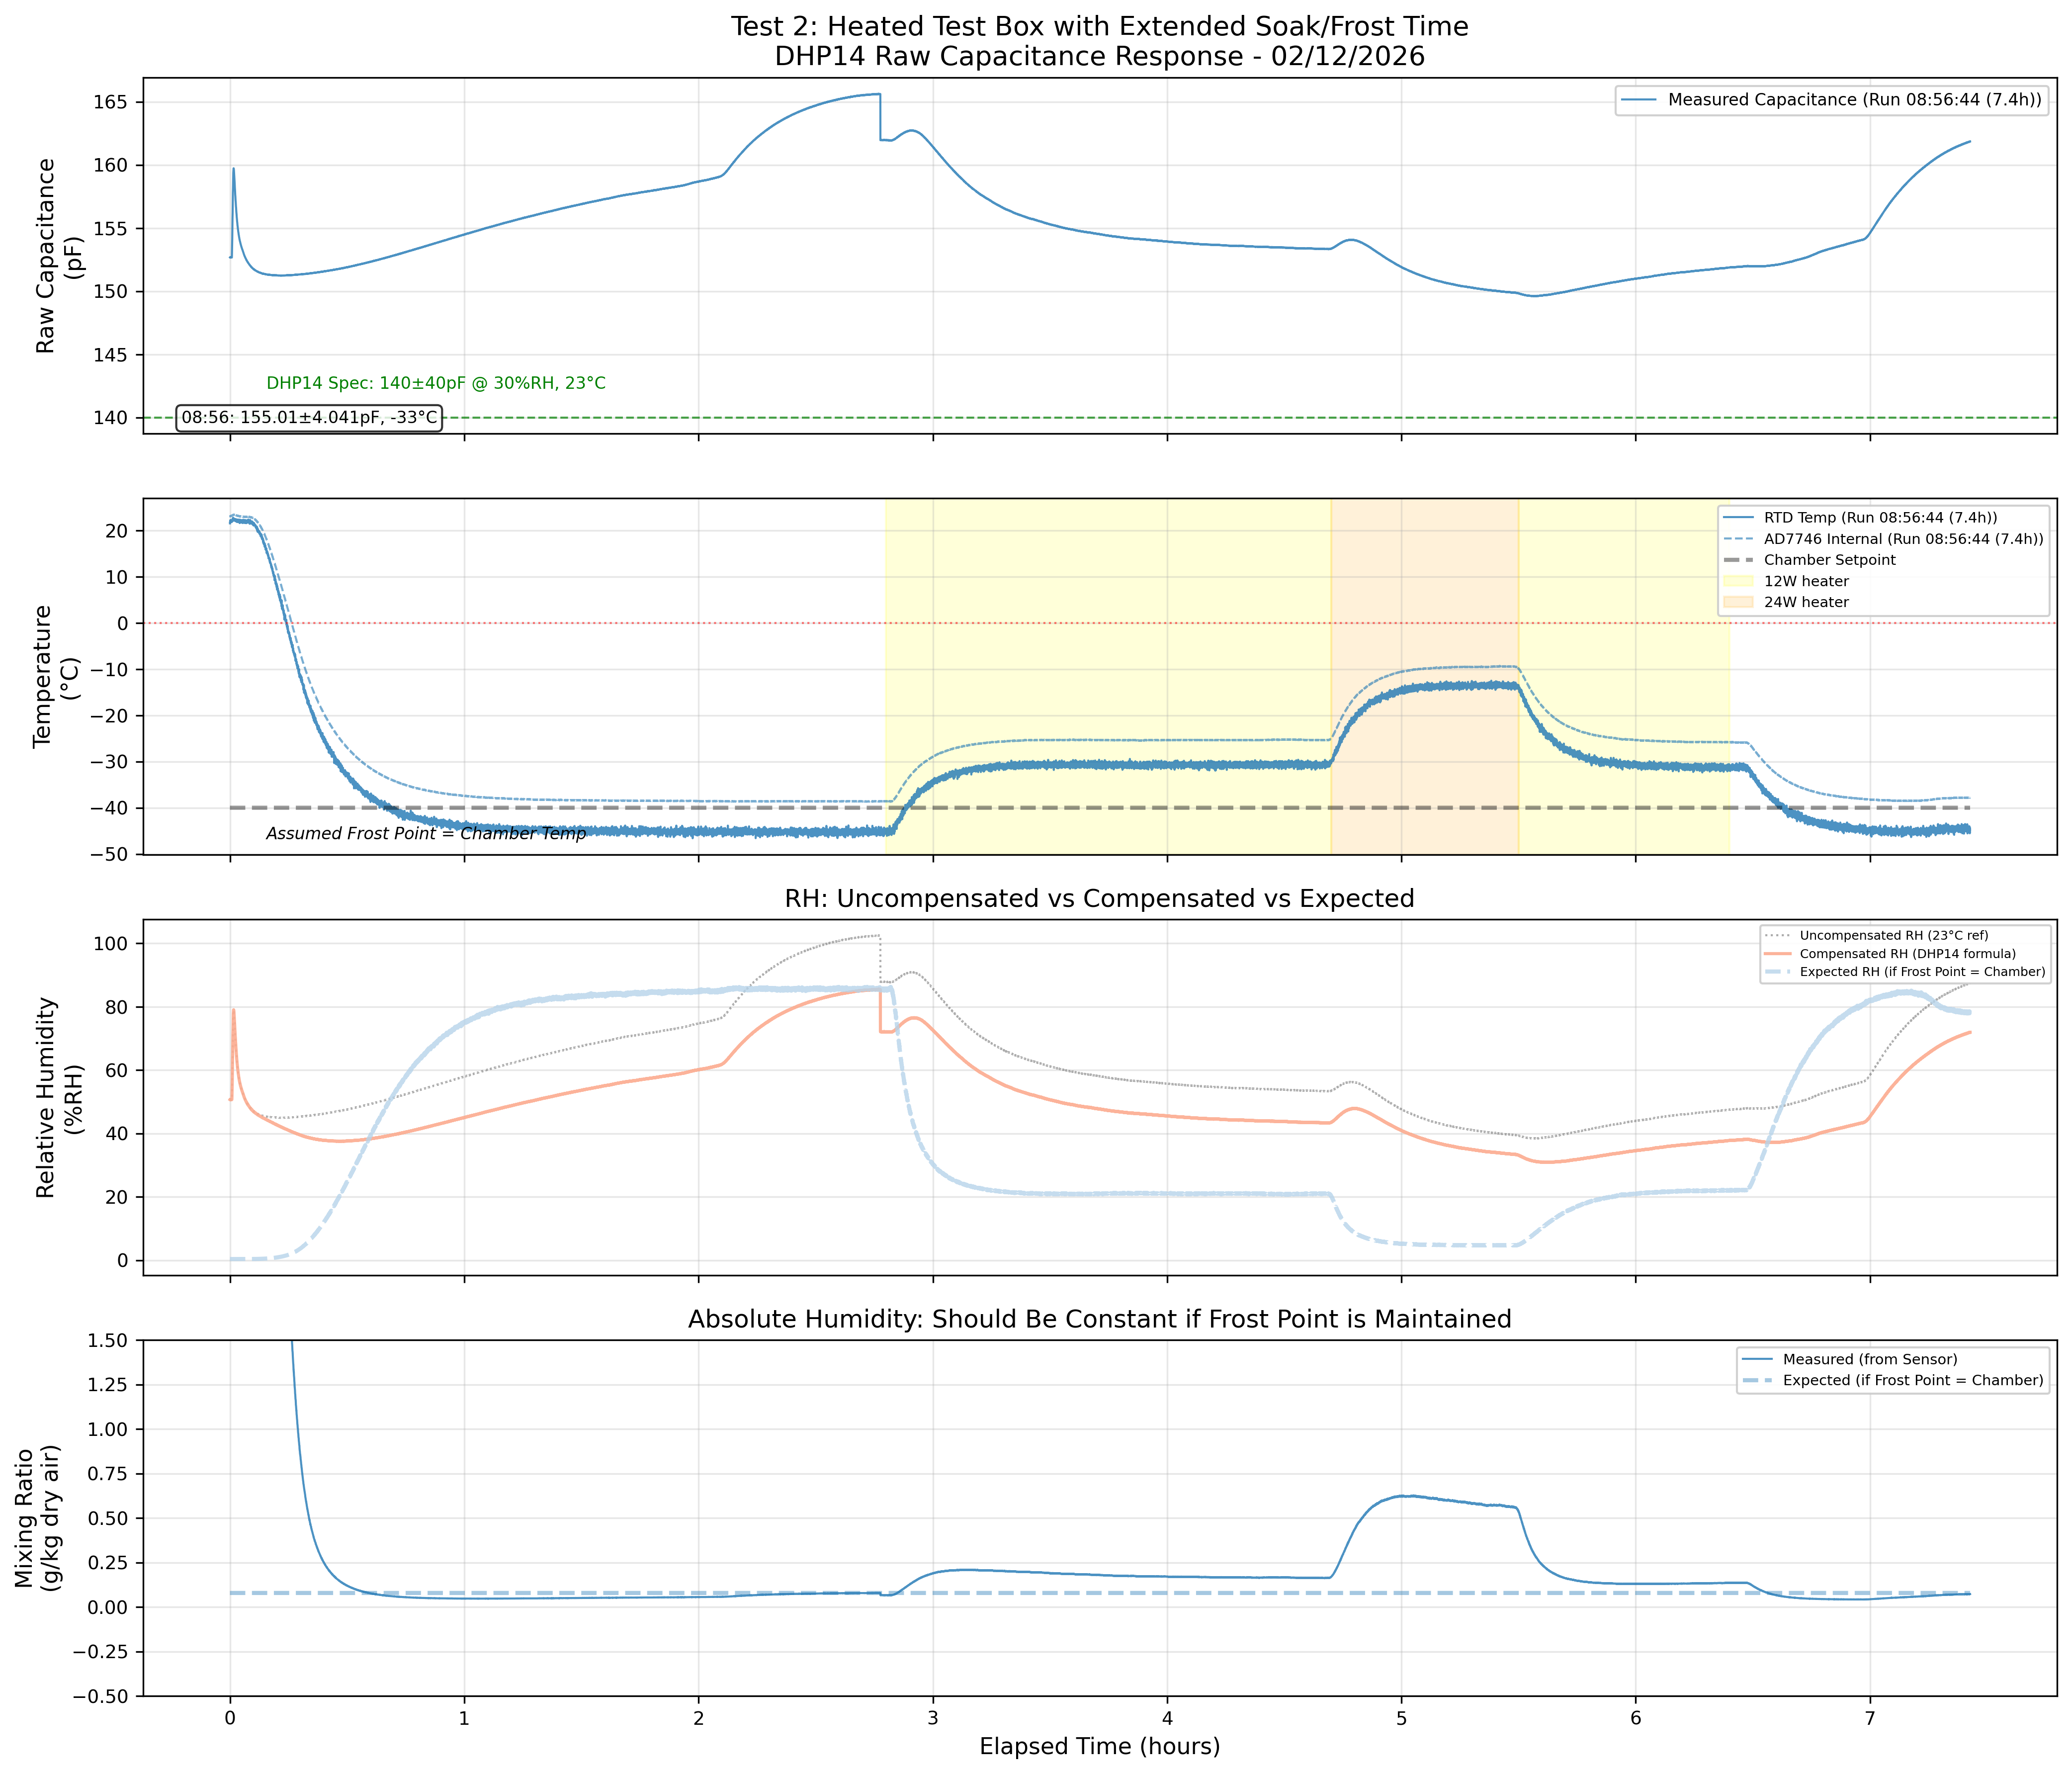
Test 2: Extended Equilibration — “What If We Just Wait Longer?”
The second attempt (February 12, two runs totaling 8.4 hours) kept the same heater differential approach but with extended equilibration: patience.
The hypothesis: maybe the system just needs more time. Let the chamber stabilize completely at target temperature before starting measurements. Flow humidified air through the saturator tube much longer to build up frost coating. Give the entire system hours to reach equilibrium instead of minutes.
What Changed
- Extended frost-building period: Flowed humid air through cold saturator for several hours before data collection
- Longer thermal soak: Allowed chamber to stabilize at target temperature for extended period
- Similar heater approach: Still used 12W/24W heater phases to create temperature differential
What the Data Shows
Panel 4 reveals the same fundamental problem: absolute humidity is not constant. The mixing ratio shows significant drift within the run, and the uncompensated vs compensated RH lines (Panel 3) show the datasheet formula is being applied but doesn’t fix the core issue.
The failure mode persists. Extended equilibration time didn’t help. The absolute humidity still doesn’t match the expected values, and still varies within the run.
The capacitance measurements remained precise (4.48 pF and 3.41 pF standard deviations), proving again that the sensor works. But the humidity readings still made no physical sense.
At this point, the realization began to form: Maybe the fundamental assumption was wrong. Maybe the tube isn’t properly iced. Maybe the air isn’t actually reaching saturation at the frost point.
If there’s no controlled ice coating inside the saturator tube, we’re not measuring air saturated at a known frost point—we’re just measuring whatever humidity happens to be present. The heater differential approach was trying to solve the wrong problem. The issue wasn’t about creating a temperature difference between the saturator and sensor. The issue was that we had no confirmed humidity reference in the first place.
Lesson: Waiting longer doesn’t create ice where none exists. Before worrying about temperature control sophistication, we needed to verify the most basic assumption: is frost actually forming uniformly in the saturator tube?
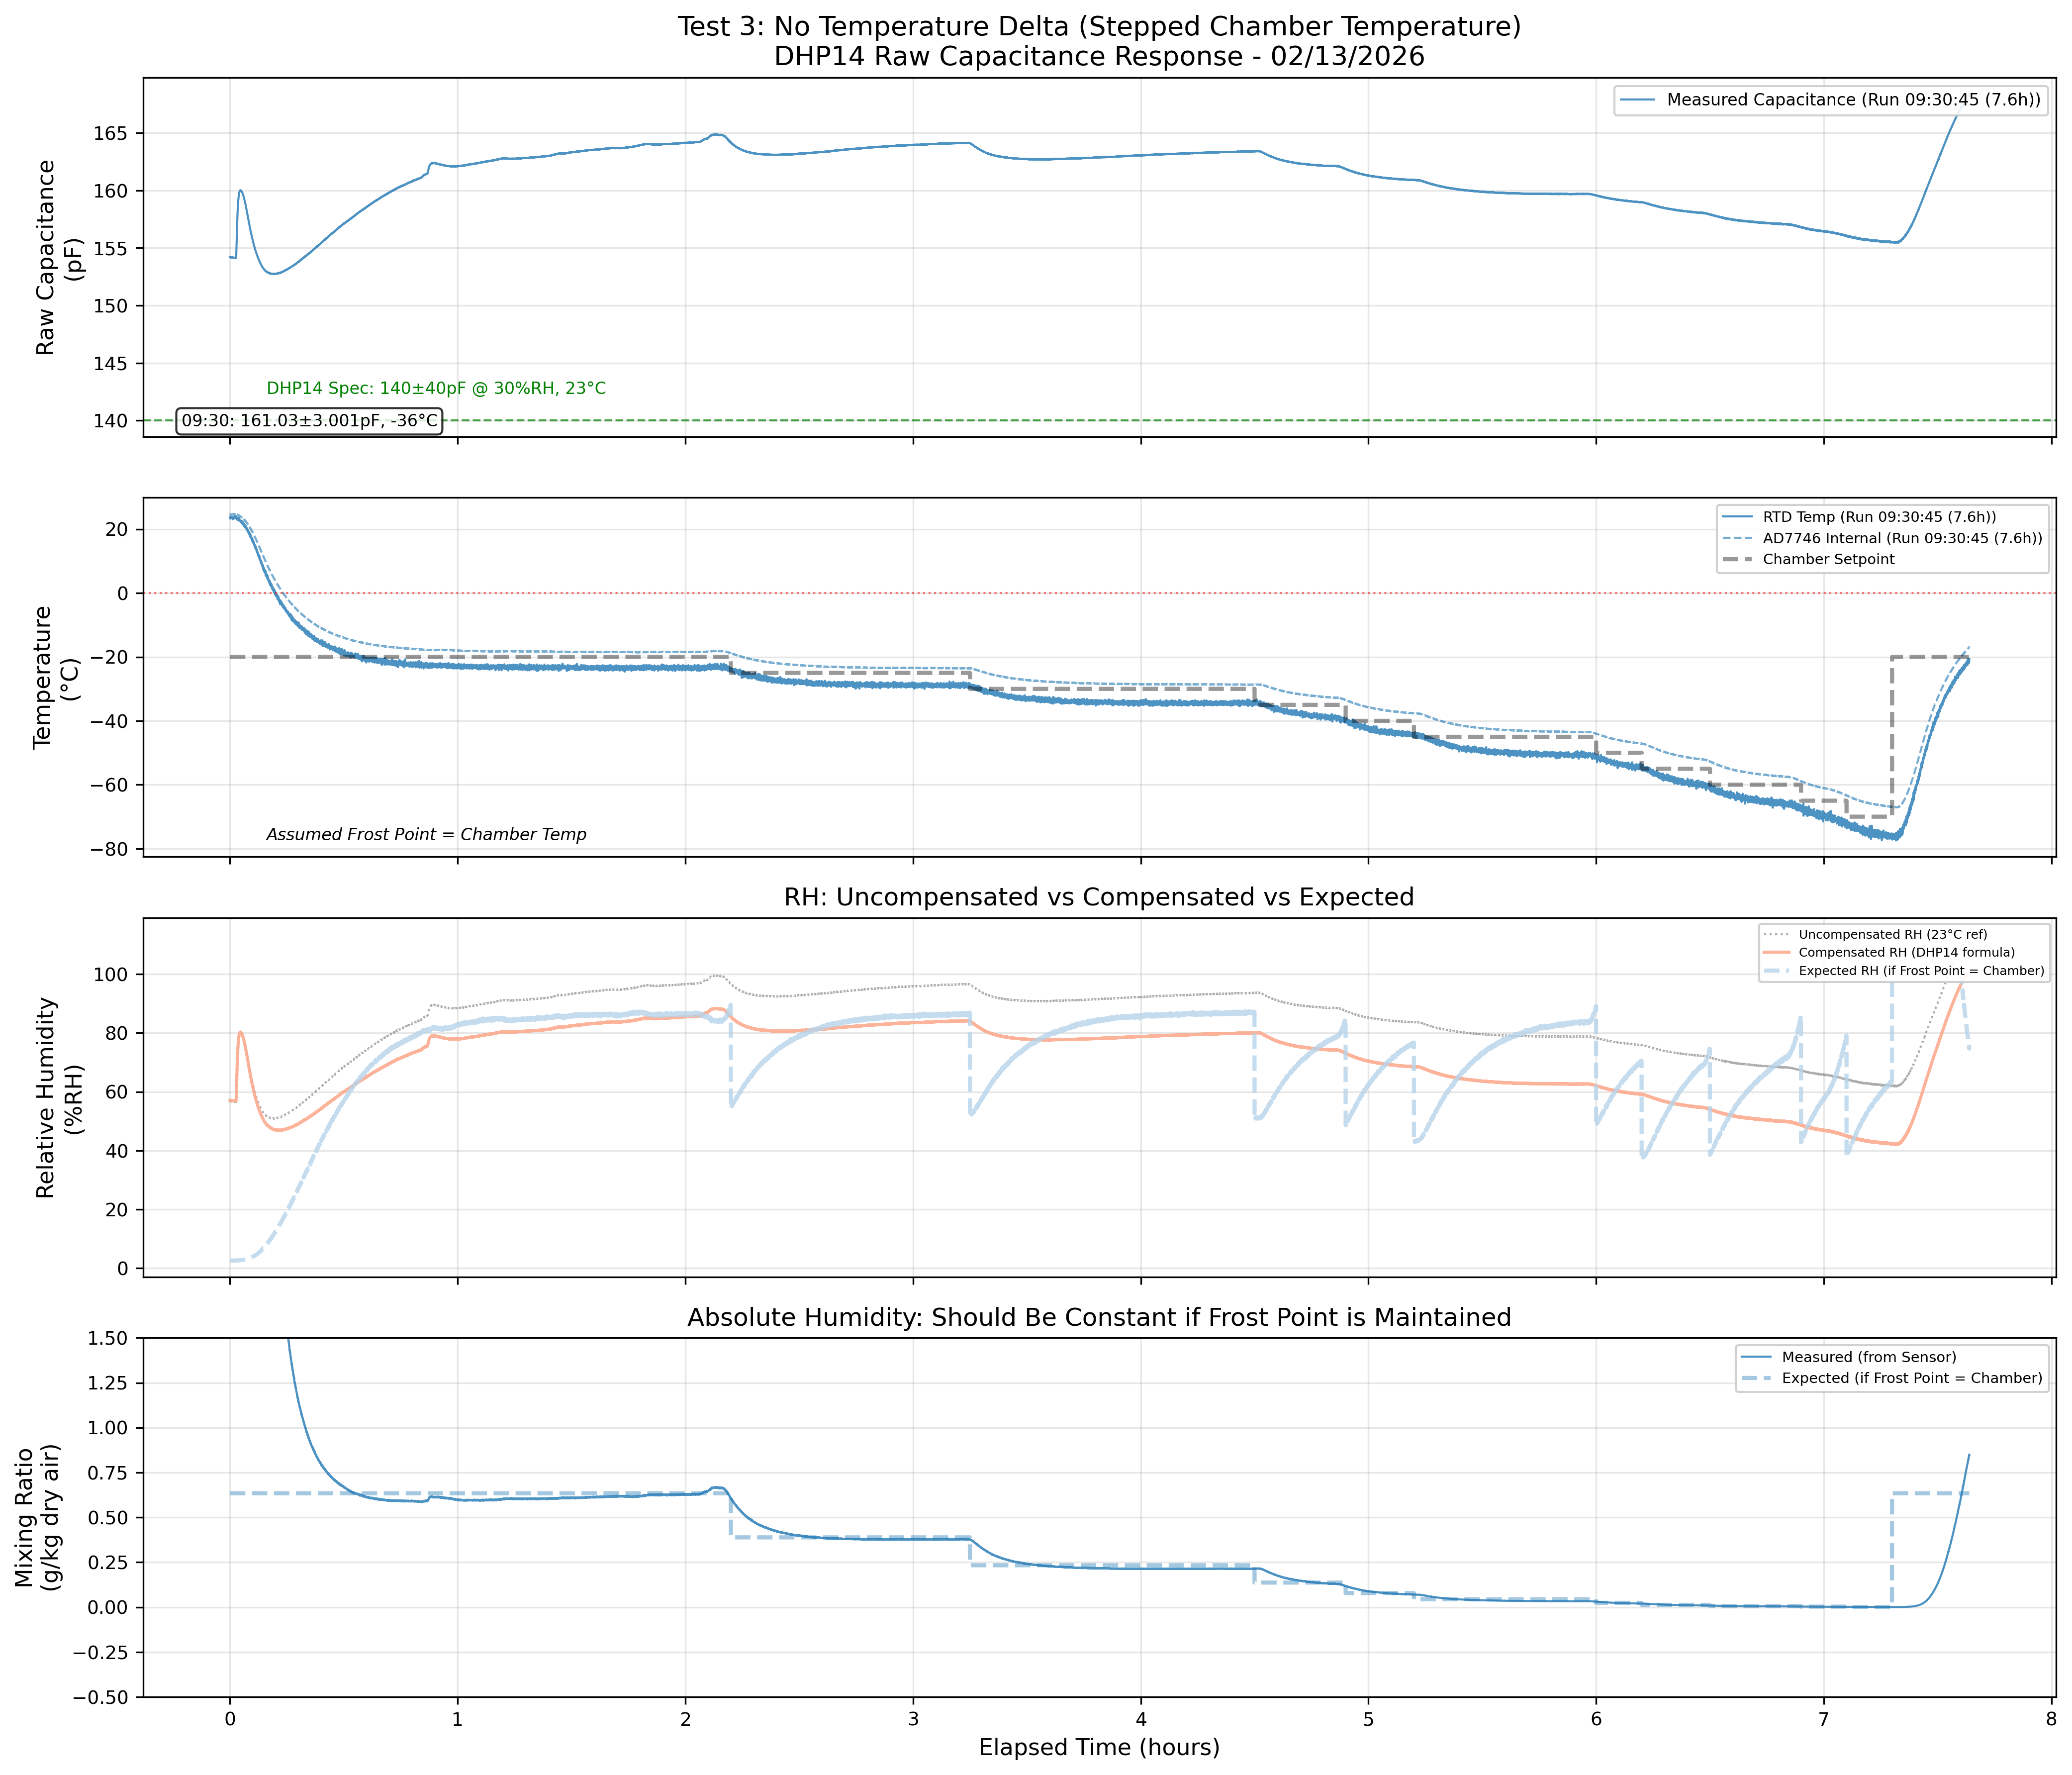
Test 3: Eliminate the Heater — Test the Ice Coating Hypothesis
The third attempt (February 13, 7.6 hours) abandoned the temperature differential entirely based on the realization from Test 2: if the tube isn’t properly iced, all the temperature control sophistication is irrelevant.
The new approach: simplify everything. Set chamber to cold temperature, let both saturator tube and test box reach the same temperature, flow humidified air through the system. No heater, no temperature differential—just the simplest possible test of whether frost formation and saturation can happen naturally.
What Changed
- No heater: Test box and saturator at same temperature
- Stepped chamber temperature: Started at -40°C, progressively cooled to colder temperatures
- Simplest possible design: Eliminate all complexity that Test 1 and 2 introduced
What the Data Shows
Panel 4 shows mixing ratio values around 35-40 g/kg—orders of magnitude higher than physically possible at the chamber temperatures. As the chamber steps from -20°C to -70°C (visible in Panel 2’s black stepped line), the expected mixing ratio should drop from ~0.77 g/kg to ~0.03 g/kg. Instead, measured values remain impossibly high.
Panel 3 shows the effect of temperature compensation: the uncompensated RH (grey dotted), compensated RH (red solid), and expected RH (blue dashed) all diverge. The DHP14 formula is being applied, but it can’t compensate for measuring the wrong reference condition.
The core problem confirmed: The measured mixing ratios are physically impossible at these temperatures. This proves the air is not saturated at the chamber temperature. The hypothesis was correct—without Greenspan’s meticulous 7-hour ice coating procedure, frost is not forming uniformly (or perhaps at all) in the saturator tube:
- Ice may preferentially nucleate at tube entrance (steepest thermal gradient) while downstream sections remain bare
- Moisture could deposit early in the tube, leaving dry air for the rest of the flow path
- Without visual confirmation (impossible in sealed coiled tube), ice coverage is unknown
- No proper equilibration period—measurements started immediately
We successfully measured capacitance with 3.0 pF standard deviation (excellent precision). But without a controlled reference condition, that precision is meaningless.
Lesson: You can’t calibrate against an uncontrolled reference. Proper ice coating and equilibration aren’t optional steps—they’re required for establishing a known humidity reference. Tests 1 and 2 weren’t failing because of temperature control issues—they were failing because we never had a proper humidity reference to begin with.
The PT1000 Reference Resistor Problem
A parallel discovery during these tests was that the PT1000 RTD circuit has a temperature accuracy problem rooted in the reference resistor.
The AD7746 measures the PT1000 via its voltage/temperature input channel, using a ratiometric measurement against a precision reference resistor. The accuracy of the temperature reading depends directly on the stability of this reference. A PT1000 changes resistance at approximately 3.85 Ω/°C. To achieve ±0.1°C temperature accuracy, the reference resistor needs to be stable to better than ±0.0385%, or roughly 385 ppm, over the operating temperature range.
The reference resistor currently in the circuit has a temperature coefficient significantly higher than ideal. Over the -60°C to +25°C temperature range (an 85°C span), a reference resistor with, say, 50 ppm/°C TCR accumulates 4250 ppm (0.425%) of resistance change—equivalent to roughly 1.1°C of temperature error in the PT1000 reading. At temperature extremes, the error is largest precisely when accuracy matters most.
The ironic finding: The AD7746’s internal temperature sensor, which is a bandgap reference on the silicon die, may actually provide more reliable temperature readings at moderate temperatures than the PT1000 with its poor reference resistor. The internal sensor isn’t suitable for precision work—it’s specified at ±2°C—but it’s self-consistent and doesn’t depend on external reference components. For temperature compensation of the humidity reading (where relative accuracy matters more than absolute accuracy), the internal sensor’s stability may be more valuable than the PT1000’s theoretical precision undermined by a drifting reference.
| The fix for the next iteration is straightforward: replace the reference resistor with a precision low-TCR part. Vishay or similar thin-film resistors with ≤5 ppm/°C TCR are readily available. A 5 ppm/°C reference over 85°C produces a 425 ppm (0.0425%) shift—equivalent to roughly 0.11°C error, well within the PT1000 Class A specification of ±(0.15 + 0.002 | T | )°C. |
Why This Is Genuinely Hard
After three failed attempts, it’s worth stepping back and acknowledging why low frost-point calibration is a difficult measurement problem—not as an excuse, but as an honest assessment that informs the next design iteration.
Surface adsorption dominates at low humidity. At -60°C frost point, the saturation vapor pressure of ice is approximately 1.08 Pa—about 11 ppm of atmospheric pressure. At these trace-level concentrations, water molecules adsorb and desorb from every surface in the system: tube walls, sensor housing, cable insulation, the sensor element itself. Greenspan gold-plated his test chamber walls to minimize this effect. Every surface in the flow path is either a moisture source or sink, and at ppm levels, even small surfaces matter.
Thermal equilibrium takes hours, not minutes. The diffusion of water vapor at low temperatures and pressures is slow. Greenspan’s theoretical analysis showed that his 16-foot saturator reduced the degree of unsaturation by a factor of e^-17 at 2 L/min flow—essentially perfect saturation. But this required 7 seconds of contact time with 1200 cm² of ice surface. Rushing the process yields gas that is partially saturated to an unknown degree.
The measurement itself perturbs the system. Introducing a sensor into a low-humidity gas stream adds surface area for adsorption, potentially warming or cooling the local environment, and creating flow disturbances. The sensor becomes part of the system being measured.
You cannot verify what you cannot see. Inside a coiled tube at -60°C in a sealed temperature chamber, there is no way to visually confirm ice formation, measure ice thickness, check for blockages, or observe condensation patterns. Greenspan’s acrylic observation windows and accessible geometry were design features, not luxuries.
These aren’t problems that scale down gracefully. Making the equipment smaller doesn’t make the physics easier—in many cases it makes it harder, because surface-to-volume ratios increase and thermal time constants decrease.
Revision 2 Design: What Changes
The three failed tests, combined with careful study of the Greenspan paper, point to specific design changes for the next iteration.
1. Low-TCR Reference Resistor for PT1000
Problem: Current reference resistor has excessive temperature coefficient, degrading PT1000 accuracy at temperature extremes.
Fix: Replace with a precision thin-film resistor, ≤5 ppm/°C TCR (e.g., Vishay TNPW series or similar). This reduces reference-induced temperature error from ~1.1°C to ~0.11°C over the full operating range, restoring the PT1000 to its Class A specification.
2. Smaller All-Aluminum Test Box
Problem: The test box volume was too large. Large volumes take longer to equilibrate, have more internal surface area for adsorption, and allow greater temperature gradients. The previous enclosure may have had non-metallic components contributing to outgassing or moisture retention.
Fix: Machine or fabricate a compact all-aluminum test box with the minimum volume needed to contain the DHP14 sensor and PT1000 RTD. Aluminum provides:
- Excellent thermal conductivity (237 W/m·K) for rapid equilibration
- Low moisture adsorption compared to plastics or composites
- Easy machinability for tight-tolerance enclosures
- Good thermal mass for temperature stability
A smaller volume means faster equilibration, more uniform temperature distribution, and less total surface area competing with the sensor for moisture exchange.
3. Parallel 1mm Tube Saturator Bundle
Problem: The single 1/2” (12.7 mm) SS tube has a relatively low surface-area-to-volume ratio for ice-gas contact. The gas at the center of the tube is ~6.35 mm from the nearest ice surface. At low temperatures and pressures, diffusion from the tube center to the ice wall limits how quickly equilibrium is achieved.
Fix: Replace the single large tube with a bundle of many 1 mm (or similar small-bore) capillary tubes in parallel. This dramatically changes the saturator physics:
| Parameter | Single 1/2” Tube | Bundle of 1mm Tubes |
|---|---|---|
| Max distance to ice | 6.35 mm | 0.5 mm |
| Surface/volume ratio | ~315 m⁻¹ | ~4000 m⁻¹ |
| Diffusion time | ~40× slower | ~40× faster |
| Flow per tube | All flow in one path | Distributed across many paths |
With the gas never more than 0.5 mm from an ice surface, the diffusion path length drops by a factor of ~12.7, and since diffusion time scales as the square of distance, the equilibration is approximately 160× faster. This is the same principle as a shell-and-tube heat exchanger versus a single large pipe.
The parallel tube bundle could be formed as a small coil or loop, keeping the total length manageable while maximizing the interior surface area contact. The key engineering challenge is ensuring uniform flow distribution across all tubes and maintaining the ability to coat all interior surfaces with ice—but the small bore diameter means even modest moisture levels should deposit visible frost quickly.
4. Proper Ice Coating Procedure
Problem: Relying on in-situ frost deposition from the humidified test gas produces unknown, non-uniform ice coverage.
Fix: Adopt a deliberate coating step inspired by Greenspan:
- Pre-dry the entire assembly thoroughly (heated dry air or nitrogen purge)
- Cool the tube bundle to the lowest operating temperature
- Flow humidified gas at a controlled, slow rate through the pre-cooled tubes
- Allow extended coating time for uniform deposition
- Dry the downstream plumbing before starting measurements
- Allow 12+ hours of equilibration at target conditions before taking data
This adds substantial time to each calibration run but is the difference between a measurement and a guess.
5. Smaller PCB
Problem: The current sensor PCB is sized for bench development convenience, not for fitting inside a compact calibration test box.
Fix: Design a minimal PCB carrying only the AD7746, DHP14 connector, PT1000 interface (with new precision reference resistor), and I2C header. Remove all development aids, diagnostic LEDs, and breadboard-friendly spacing. Target the smallest footprint that fits inside the new aluminum test box with the sensor element exposed to the calibration atmosphere.
The Surface Area Argument: Why Smaller Tubes Matter
The shift from a single large tube to parallel small tubes deserves deeper justification because it’s the most significant design change and touches on the fundamental physics of the problem.
Greenspan’s saturator achieved e^-17 unsaturation (essentially perfect saturation) with a 16-foot, 3/8” tube at 2 L/min. The key parameters were:
- Interior surface area: ~1200 cm²
- Gas transit time: ~7 seconds
- Maximum diffusion distance: ~4.8 mm (tube radius)
The critical length for 1/e unsaturation reduction was 29 cm based on a water-in-air diffusion constant of 0.1 cm²/s at atmospheric pressure and -80°C.
For a bundle of 1 mm tubes at equivalent total flow rate:
- Each tube carries a small fraction of the total flow
- The maximum diffusion distance is 0.5 mm (tube radius)
- The critical length for 1/e reduction scales as r²/D, where r is radius and D is diffusivity
- For r = 0.5 mm: critical length ≈ 29 cm × (0.5/4.8)² ≈ 0.31 cm
This means each 1 mm tube needs only ~3 mm of ice-coated length to achieve the same degree of saturation that required 29 cm in Greenspan’s 3/8” tube. Even a modest tube bundle a few inches long would provide hundreds of times the necessary saturation length—an enormous safety margin.
The practical implication: the tube bundle can be short (a small loop or coil rather than 16 feet), making it physically compatible with a compact temperature chamber while providing better saturation than the original large-tube design.
Summary: Three Tests, Progressive Learning
Across all three tests (66,902 total samples over 21.5 hours), the AD7746+DHP14 sensor demonstrated excellent measurement precision: capacitance standard deviations of 2.1-4.0 pF represent sub-femtoFarad noise floors and signal-to-noise ratios >50:1.
But that precision measured nothing useful. The absolute humidity calculations (Panel 4 in each test plot) show the sensor was not measuring air at a stable, known frost point. Instead of flat mixing ratio lines indicating constant absolute humidity, all three tests showed significant drift and values orders of magnitude higher than expected.
The three tests represented progressive understanding:
| Test | Initial Hypothesis | What Happened | What We Learned |
|---|---|---|---|
| Test 1 | Create temp differential with heater | Results unclear, abs humidity doesn’t match expected | Maybe needs longer equilibration time? |
| Test 2 | Same as Test 1, but wait longer | Still doesn’t work | Wait—maybe the tube isn’t iced and air isn’t saturated |
| Test 3 | Simplify everything to test ice coating theory | Abs humidity physically impossible | Confirmed: no controlled ice coating = no humidity reference |
Looking back with the benefit of retrospective analysis, it’s clear that Test 1 also suffered from thermal instability—placing a heater and cooler in the same chamber creates competing heat flows and unpredictable gradients. But that wasn’t obvious at the time. What became obvious by Test 3 was the more fundamental problem: without Greenspan’s meticulous ice coating procedure, we never established a controlled humidity reference in the first place.
The sensor system is not the problem. The calibration reference is the problem.
The Path Forward
The revised calibration system design addresses the identified problems:
| Problem | Root Cause | Revision 2 Fix |
|---|---|---|
| No humidity reference | Uncontrolled frost deposition | Deliberate ice coating procedure with proper dry-down |
| Poor gas-ice contact | Single large-diameter tube | Parallel 1mm tube bundle, ~12× shorter diffusion path |
| Reference resistor drift | High-TCR reference in PT1000 circuit | Precision ≤5 ppm/°C thin-film resistor |
| Sensor PCB too large | Bench development layout | Minimum-footprint PCB for test box |
| Large test box volume | Slow equilibration, surface effects | Compact all-aluminum test box |
| Insufficient equilibration | Measurements started immediately | 12+ hour equilibration protocol |
The next iteration will also incorporate two procedural changes learned from Greenspan:
-
Pre-dry everything. Before any cold test, purge the entire assembly with dry nitrogen at elevated temperature. Surface-adsorbed moisture is the enemy of low-humidity calibration.
-
Be patient. Low frost-point calibration at NBS was a multi-day process because the physics requires it. Planning for 24-48 hour test runs rather than a few hours is not pessimism—it’s realism.
Closing Thoughts
There’s a comfort in reading Greenspan’s 1973 paper because it simultaneously validates that this is genuinely hard and shows that it is genuinely possible. NBS spent substantial resources—NASA Viking Project funding—and dedicated years of expertise to achieve ±0.05°C frost-point uncertainty. But they also did it with 1970s instrumentation: resistance thermometers, mechanical pressure gauges, bellows valves, and manual data recording every 10 minutes.
We have 24-bit CDCs, sub-attoFarad noise floors, automated data logging at 1 Hz, and precision temperature chambers that maintain ±0.1°C without requiring exotic five-component cryogenic bath fluids. The measurement technology has advanced enormously. What hasn’t changed is the thermodynamics: water vapor at ppm concentrations interacts with every surface, reaches equilibrium slowly, and punishes impatience.
The sensor system works. That was established in the room-temperature characterization. The next challenge isn’t sensor precision—it’s generating a known humidity reference at the conditions we need to validate. Three failed attempts have mapped the failure modes. The fourth attempt, with a properly designed saturator, precision reference components, and a realistic protocol, has a materially better chance of producing calibration data worth trusting.
Sometimes the most productive day in the lab is the one where you finally understand why yesterday’s experiment was doomed before you turned it on.
Related Posts
This post is part of the Stratosonde sensor characterization series:
- Precision Humidity Sensing: Replacing the SHT31 — Room temperature characterization of the AD7746 + DHP14 + PT1000 system
- BQ25570 Bench Characterization — Solar harvester performance
- HTC1015 LTO Temperature Characterization — Battery performance at -60°C
- Ceramic Capacitor Bank Validation — Power system at extreme cold
References
-
Greenspan, L. “Low Frost-Point Humidity Generator.” Journal of Research of the National Bureau of Standards—A. Physics and Chemistry, Vol. 77A, No. 5, September–October 1973, pp. 671–677.
-
Analog Devices, “AD7745/AD7746 24-Bit Capacitance-to-Digital Converter with Temperature Sensor,” Datasheet Rev. B.
-
Innovative Sensor Technology, “DHP14-Rapid-W Capacitive Humidity Sensor,” Datasheet Rev. 5.
-
IST AG, “PT1000 Class A RTD, P1K0.232.6W.A.010,” Datasheet DTP600_E.
Raw test data: sensor_log_20260213_093045.csv
NBS Paper: Greenspan 1973 — Low Frost-Point Humidity Generator (PDF)